At the time of writing this, Apple Inc. is the "most valuable" company on the US public market with a market cap of roughly $2.1 trillion. But what does that mean? Where does that number come from?
There are many great sources online that answer the first question, for example Investopedia has a good overview of market capitalization and how it can be factored into investment decisions. I'm not an expert in finance, I can't tell you how to use market caps to build a trading bot and make a bajillion dollars. I'm a software engineer who works in fin-tech. Part of the job includes dissecting high level financial concepts to figure out how we can provide them to our users. The goal of this blog post is to dig deeper into the second question:
Where does market cap come from?
At Polygon, we provide a platform for financial data. Part of that platform includes a service (Ticker Details) which returns, among other things, market cap for a given stock ticker. When we set out to create that service, we were lured in by the enticingly simple formula for market cap that you'll find across many different sources online:
For most people, this is all you need to know to understand market cap as a concept. As it turns out, this formula is technically correct, but it's hiding significant complexity behind it.
To illustrate that complexity, join me as I take you down the rabbit hole that is market caps, share classes, and outstanding shares.
Market Caps in Practice
So all we need to calculate market cap for a ticker is a stock price and the number of shares outstanding. How do we get those two data points?
As an individual, stock prices are readily available online. You can even get end-of-day prices programmatically from Polygon for free!
Now how about shares outstanding?
US public companies are required to file quarterly (10-Q) and annual (10-K) financial reports with the SEC, which are then made publicly available. These filings disclose the number of shares in a company that are available to buy, perfect! Note that since we're looking at quarterly filings, this number might be up to 3 months out of date. The number of outstanding shares might change at any time because of corporate actions like splits, mergers, acquisitions, etc. For the sake of demonstration, quarterly numbers will do.
Let's use our formula to calculate Apple's market cap:
On 2022-12-19, AAPL closed at $132.37 per share. Apple's most recent 10-K filing states that as of 2022-10-14, there were 15,908,118,000 AAPL shares outstanding.
There's our $2.1 trillion number, this is easy! So we're done, right?
Not quite...
There are over 30,000 active tickers on the US public market, we should look at some more before we jump to any conclusions. Let's start with Berkshire Hathaway. More specifically: BRK.A.
Already this one seems different. What is that
.A
suffix at the end? Let's not think about that for now and try to apply our formula.
On 2022-12-19, BRK.A closed at $455,280.00 (not a typo, BRK.A is the most expensive single stock you can buy at the moment!). Next we'll take a look at Berkshire Hathaway Inc.'s most recent 10-Q filing...wait, this looks different:
Number of shares of common stock outstanding as of October 26, 2022: Class A — 596,826 Class B — 1,301,981,370
Berkshire Hathaway has two classes of stock?
Well, yes. Turns out the
.A
suffix was pretty important. BRK.A and BRK.B both represent stock in the same company. This highlights our first main problem with calculating market caps for stock tickers:
Market caps relate to companies, but stock tickers don't always correlate one-to-one with a company.
Our simple equation for market cap worked for Apple because AAPL is the only share class that Apple offers. If a company has multiple share classes, like Berkshire Hathaway, we need to take that into account.
We could simply sum up the "market cap" of BRK.A and BRK.B to arrive at the true market cap of Berkshire Hathaway. While that would work in this case, it won't work in the general case. Some companies consist of public and private share classes. We can't reliably get a price for private shares, so we need another solution.
Tangent: Share Classes and Par Value
Let's take a step back.
What even is a share class?
Why would a company have multiple share classes?
Briefly: different share classes tend to bring with them different voting rights. Sometimes specific share classes are reserved for internal employees and aren't publicly traded. For more details around share classes, this article is very informative.
Another aspect of share classes that is rarely discussed is par value. AAPL par value per share is $0.00001 (this is disclosed in SEC filings). Par value is usually explained as the lower bound for how much a stock can trade for. Companies will set it very low to make sure it never interferes with the market value of a share. Practically speaking, AAPL stock is trading at over $130 per share, so par value doesn't come into play very often as a lower bound.
More importantly, par value is a relative measure of how much weight a share class has within a company. Par values cannot be compared across different companies. For companies with only one share class, par values are not very interesting. The sole share class accounts for 100% of the company no matter what the par value itself is. For companies with multiple share classes, we can look at their par values as a way to gauge their value relative to each other.
Looking at Berkshire Hathaway again: BRK.A and BRK.B trade at dramatically different prices, $455,280.00 and $300.03 respectively. Can we correlate this difference with the par values of these two share classes?
It turns out we can! If we look back inside that Berkshire Hathaway 10-Q, we'll see that class A shares (BRK.A) have a par value of $5 and class B shares (BRK.B) have a par value of $0.0033. That puts the ratio of BRK.A to BRK.B par values at ~1,515:1. The ratio of BRK.A to BRK.B stock price comes out to ~1,517:1. Coincidence? Not at all.
Prices and par values of share classes from the same company are directly related.
Strictly speaking, there's no rule or law that forces the share prices to align with their par values like this. In practice, the market keeps these prices in line through various means like arbitrage. The core mechanic that makes it work is the ability to convert shares of one class to shares of another class at a fixed rate. Like most things in finance, it's not really that simple. Share class arbitrage is the topic of many research papers and we won't be getting into it here.
Back to Market Caps
Recall that we're looking for a general solution to calculate market cap for a company. Our current problem is that we may not have access to pricing information for all of that company's share classes.
We somehow need a way to relate a single share class to the whole company. Let's recap what we know about Berkshire Hathaway share classes:
Class A
596,826 shares outstanding
$5 par value per share
Class B
1,301,981,370 shares outstanding
$0.0033 par value per share.
We know from the 10-Q that these are the only two share classes of Berkshire Hathaway stock. That means that together, all of these shares account for all available equity of Berkshire Hathaway. Can we figure out what percentage of available equity is in Class A shares?
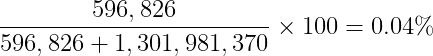
In terms of raw number of shares, class A shares account for only 0.04% of all available Berkshire Hathaway shares:
That doesn't seem right. We know that one class A share is worth roughly 1,515 class B shares because of their par values. Let's consider that in our calculation:
Now that number seems a lot more realistic. But how does this relate to market caps? Well, let's now calculate the "market cap" of just BRK.A:
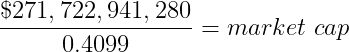
We know that BRK.A shares account for 40.99% of Berkshire Hathaway, so we can extrapolate what we know about BRK.A to determine the market cap of Berkshire Hathaway as a whole:
And there you have it: market cap for an entire company using share price of only one share class. This works because the relationship between share classes is public information, even if not all share classes are publicly traded.
If you look at just about any source for Berkshire Hathaway market cap, you'll see a number around $662 billion (as of 2022-12-19).
The "Real" Formula for Market Cap
We've come a long way from our original, simple formula for market cap. Let's take what we just learned and come up with a revised formula for market cap:
Did you catch the difference? Instead of multiplying share price by shares outstanding, we multiply share price by weighted shares outstanding.
Weighted shares outstanding is a hypothetical value. It encapsulates everything we just did with Berkshire Hathaway in the previous section in a neat and tidy package: It represents the equivalent number of shares of a particular share class that equates to the whole company.
Unfortunately we can't just hand-wave away all the complexity of dealing with multiple share classes (actually, if you're using Polygon's API, you can!). Weighted shares outstanding is a stand-in for all that complexity.
To calculate weighted shares outstanding, we need:
shares outstanding for each share class
par value per share for each share class
Then, given share classes A through Z, apply the following formula to calculate weighted shares outstanding for share class
A
:
This equation sums up the outstanding shares of each share class weighted by their par value, then divides out the par value of the share class we're interested in to get a count of shares outstanding for that class. Notice this is very similar to what we were doing to determine what percentage of available equity in Berkshire Hathaway is in Class A shares. It's just rearranged and more generalized.
Let's calculate Berkshire Hathaway's market cap one last time with our new formula. Once again, here's what we know about Berkshire Hathaway's share classes (all from that same 10-Q):
Class A
596,826 shares outstanding
$5 par value per share
Class B
1,301,981,370 shares outstanding
$0.0033 par value per share.
Now let's plug it all into our formula to calculate weighted shares outstanding for class A shares:
Before we use this number to calculate market cap, let's take a second to consider what this value actually means.
There are 596,826 actual shares of BRK.A on the market. Additionally, there are 1,301,981,370 actual shares of BRK.B on the market. Based on their par values, ~1,515 shares of BRK.B equates to 1 share of BRK.A. Hypothetically, if we were to convert every share of BRK.B into BRK.A using this ratio, we'd end up with a total of 1,456,133.70 shares of BRK.A. In this hypothetical world, BRK.A is now the only share class that Berkshire Hathaway offers so we can use the simplified equation to calculate market cap:
There's our $662 billion again. Ok, the numbers aren't exactly the same, but that's only because we've been rounding along the way for the sake of demonstration.
Note that since BRK.B is also a publicly traded stock, we can calculate this same $662 billion figure based on the hypothetical world where we convert all BRK.A shares into BRK.B shares instead of the other way around. I'll leave that as an exercise for the overachievers out there.
The Rabbit Hole Goes Deeper...
Remember earlier when I said there were over 30,000 active tickers on the market? And that we should look at more than one before jumping to conclusions? Well three (AAPL, BRK.A, BRK.B) isn't enough either.
We need to be a bit more systematic about this. The three tickers we've looked at so far were all "Common Stock". Common stock (or the equivalent "ordinary shares") tickers make up about 61% of tickers. What we learned today applies to those types of tickers.
One of the key points we learned earlier was that a stock ticker doesn't always correlate one-to-one with a company. In some cases, a stock ticker doesn't represent any real stake in a company at all.
Consider the second most common type of ticker on the market: ETF. Roughly 11% of tickers are ETFs. Buying an ETF doesn't give you any rights in the companies that the ETF has holdings of. Voting rights generally go to the fund manager, not you. For ETFs, you can calculate a "market cap" by using the traditional formula. Weighted shares outstanding can be simplified to just shares outstanding of the ETF, since there aren't any other share classes to consider. In reality this doesn't mean the same thing as a company's market cap, but you can use it to compare the sizes of similar ETFs.
So our formula covers ~72% of stock tickers, what about the rest? For some types of tickers, market cap simply doesn't apply. Take warrants for example: warrants are closer to options than common stock. They represent the right to buy a stock, not an actual stock. Once again I'll defer to Investopedia on the specifics. Suffice to say a warrant doesn't have an immediate impact on a company's valuation, and therefore shouldn't be considered when trying to calculate a company's market cap.
In practice, the last type of ticker we need to worry about for market caps are American depository receipts (ADRs). ADR tickers represent stock in foreign companies and account for ~8% of tickers in the US market. They're quite interesting, and calculating market cap for an ADR means calculating the market cap of a foreign company. Foreign companies offering ADRs in the US have different reporting requirements with the SEC. Calculating market caps for foreign companies is similar to doing so for US companies, but there's enough nuance involved that I won't get into it in this post.
For now, I hope you've learned something interesting along your way through this rabbit hole. We're not quite at the bottom just yet, stay tuned for a follow-up detailing the nuances around market caps for ADRs.
Polygon.io is excited to announce a new partnership with Benzinga, significantly enhancing our financial data offerings. Benzinga’s detailed analyst ratings, corporate guidance, earnings reports, and structured financial news are now available through Polygon’s REST APIs.
This tutorial demonstrates how to detect short-lived statistical anomalies in historical US stock market data by building tools to identify unusual trading patterns and visualize them through a user-friendly web interface.


![share price x #shares outstanding = market cap[BRK.A]](/_next/image?url=https%3A%2F%2Fpolygon.io%2Fblog%2Fcontent%2Fimages%2F2022%2F12%2Fimage-15.png&w=3840&q=75)


![(Sum[Z] to [n=A] shares outstanding [n] x par value [n])/par value[A] = weighted shares outstanding[A]](/_next/image?url=https%3A%2F%2Fpolygon.io%2Fblog%2Fcontent%2Fimages%2F2022%2F12%2Fimage-22.png&w=3840&q=75)
![(shares outstanding[BRK.A] x par value[BRK.A]) + (shares outstanding[BRK.B] x par value[BRK.B])/par value[BRK.A]](/_next/image?url=https%3A%2F%2Fpolygon.io%2Fblog%2Fcontent%2Fimages%2F2022%2F12%2Fimage-23.png&w=3840&q=75)
![(596,826 x 5) + (1,301,981,370 x 0.0033)/5 = weighted shares outstanding[BRK.A]](/_next/image?url=https%3A%2F%2Fpolygon.io%2Fblog%2Fcontent%2Fimages%2F2022%2F12%2Fimage-24.png&w=3840&q=75)
![1,456,133.70 = weighted shares outstanding[BRK.A]](/_next/image?url=https%3A%2F%2Fpolygon.io%2Fblog%2Fcontent%2Fimages%2F2022%2F12%2Fimage-25.png&w=3840&q=75)
![share price[BRK.A] x weighted shares outstanding[BRK.A] = market cap](/_next/image?url=https%3A%2F%2Fpolygon.io%2Fblog%2Fcontent%2Fimages%2F2022%2F12%2Fimage-26.png&w=3840&q=75)