Introducing
New Technical Indicators APIs
Sep 6, 2022
After hundreds of requests from our community, we’re happy to announce the release of our new Technical Indicators APIs.
Built directly on top of the pricing data APIs you already love and trust, we’ll provide a few of the most popular technical indicators so you can spend more time building and optimizing your models and less time writing logic to calculate these data points yourself.
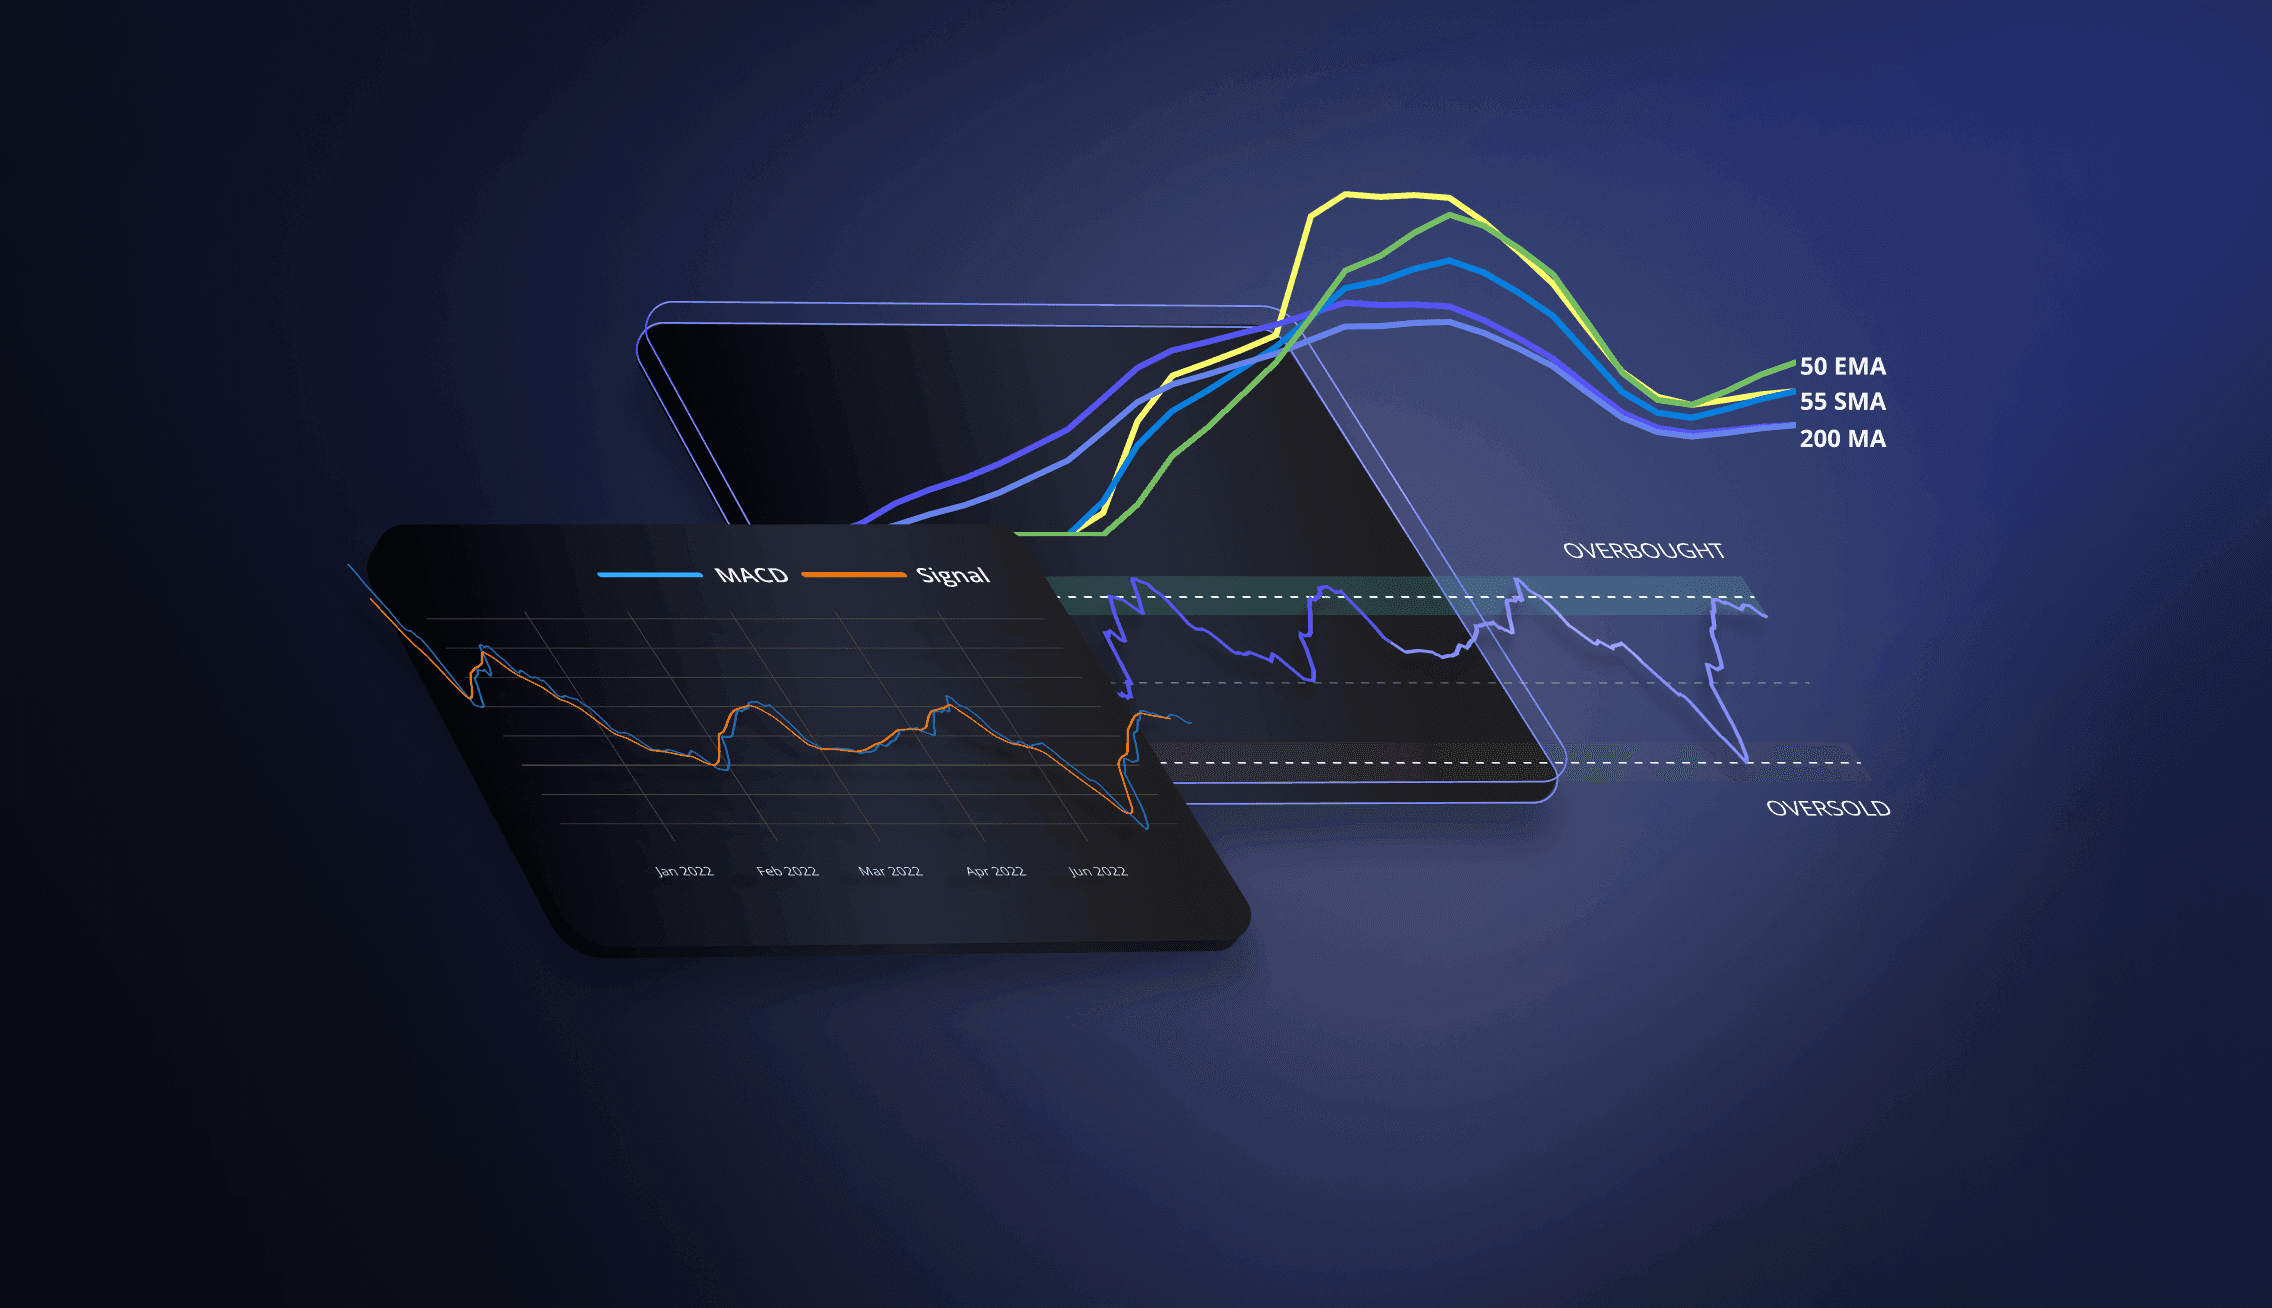
Moving averages are some of the best tools for technical analysis. There are several moving average indicators using different series of data over given periods of time, but these are the ones we chose for our initial release of indicators:
Simple Moving Average (SMA): This one is pretty simple. SMA is the average price over a specified period of time. Below we will see the response object returned by the SMA RESTful API:
{
 "next_url": "https://api.polygon.io/v1/indicators/sma/AAPL?cursor=YWN0aXZlPXRydWUmZGF0ZT0yMDIxLTA0LTI1JmxpbWl0PTEmb3JkZXI9YXNjJnBhZ2VfbWFya2VyPUElN0M5YWRjMjY0ZTgyM2E1ZjBiOGUyNDc5YmZiOGE1YmYwNDVkYzU0YjgwMDcyMWE2YmI1ZjBjMjQwMjU4MjFmNGZiJnNvcnQ9dGlja2Vy",
 "request_id": "a47d1beb8c11b6ae897ab76cdbbf35a3",
 "results": {
  "underlying": {
   "aggregates": [
    {
     "c": 75.0875,
     "h": 75.15,
     "l": 73.7975,
     "n": 1,
     "o": 74.06,
     "t": 1577941200000,
     "v": 135647456,
     "vw": 74.6099
    },
    {
     "c": 74.3575,
     "h": 75.145,
     "l": 74.125,
     "n": 1,
     "o": 74.2875,
     "t": 1578027600000,
     "v": 146535512,
     "vw": 74.7026
    }
   ],
   "url": "https://api.polygon.io/v2/aggs/ticker/AAPL/range/1/day/2003-01-01/2022-07-25"
  },
  "values": [
   {
    "timestamp": 1517562000016,
    "value": 140.139
   }
  ]
 },
 "status": "OK"
}
The “values” array contains the timestamp for the beginning of the period, as well as the SMA value for that period.
There is also a parameter to include the underlying aggregate values in response with a link to the request itself. The example above showcases the underlying aggregates included.
Exponential Moving Average (EMA): A bit more complex; this moving average is similar to SMA but places greater weight on more recent data, as it is viewed as more relevant or important. The EMA’s response object is consistent with SMA's response object.
Moving Average Convergence/Divergence (MACD): This is a momentum indicator that is calculated by subtracting the 26-period EMA from the 12-period EMA. Traders use MACD to determine whether market trends are accelerating by evaluating whether the value is above or below the signal line. The signal line is the difference between the two EMAs. The histogram value indicates the distance the MACD is away from the signal line and the direction in which momentum is moving.
{
 "next_url": "https://api.polygon.io/v1/indicators/macd/AAPL?cursor=YWN0aXZlPXRydWUmZGF0ZT0yMDIxLTA0LTI1JmxpbWl0PTEmb3JkZXI9YXNjJnBhZ2VfbWFya2VyPUElN0M5YWRjMjY0ZTgyM2E1ZjBiOGUyNDc5YmZiOGE1YmYwNDVkYzU0YjgwMDcyMWE2YmI1ZjBjMjQwMjU4MjFmNGZiJnNvcnQ9dGlja2Vy",
 "request_id": "a47d1beb8c11b6ae897ab76cdbbf35a3",
 "results": {
  "underlying": {
   "url": "https://api.polygon.io/v2/aggs/ticker/AAPL/range/1/day/2003-01-01/2022-07-25"
  },
  "values": [
   {
    "histogram": 38.3801666667,
    "signal": 106.9811666667,
    "timestamp": 1517562000016,
    "value": 145.3613333333
   },
   {
    "histogram": 41.098859136,
    "signal": 102.7386283473,
    "timestamp": 1517562001016,
    "value": 143.8374874833
   }
  ]
 },
 "status": "OK"
}
Relative Strength Index (RSI): Represented as a number between 0 and 100, RSI analyzes whether a security's price movement is a product of it being overbought or oversold. A security is generally considered oversold when the RSI is below 30 and overbought when the RSI is above 70.
{
 "next_url": "https://api.polygon.io/v1/indicators/rsi/AAPL?cursor=YWN0aXZlPXRydWUmZGF0ZT0yMDIxLTA0LTI1JmxpbWl0PTEmb3JkZXI9YXNjJnBhZ2VfbWFya2VyPUElN0M5YWRjMjY0ZTgyM2E1ZjBiOGUyNDc5YmZiOGE1YmYwNDVkYzU0YjgwMDcyMWE2YmI1ZjBjMjQwMjU4MjFmNGZiJnNvcnQ9dGlja2Vy",
 "request_id": "a47d1beb8c11b6ae897ab76cdbbf35a3",
 "results": {
  "underlying": {
   "url": "https://api.polygon.io/v2/aggs/ticker/AAPL/range/1/day/2003-01-01/2022-07-25"
  },
  "values": [
   {
    "timestamp": 1517562000016,
    "value": 54.139
   }
  ]
 },
 "status": "OK"
}
How does it work?
In summary, our new Technical Indicators API requeststhe underlying aggregates from our Aggregates API and uses those prices to construct technical indicators. The new API has similar flexibility to the Aggregates API in that one can specify date ranges over which indicator data is desired, the timespan of the aggregates, whether the aggregates are adjusted for splits, and the order in which data is returned.
We've introduced a few new query parameters for these technical indicators. All 4 of the indicators we introduced are moving averages calculated over a window or made up of moving averages calculated over a window. Thus, all endpoints now have a window parameter. For example, a 10-day SMA would be calculated by summing prices over the last ten daily aggregates (including the current day) and dividing that value by 10. This window corresponds to the timespan of the underlying aggregates. So if a user requests SMA data and specifies a timespan of "minute" and a window of 20, each value will be calculated using prices from the previous 20 1-minute-aggregates, including the current one.
Simple moving averages (SMA), exponential moving averages (EMA), and relative strength index (RSI) all have only one window parameter. Moving average convergence divergence (MACD) has three different window parameters. This is because the MACD is composed of multiple moving averages with different windows. We will need to specify "short_window", "long_window", and "signal_window" to request MACD successfully. Here's an example for querying TSLA's minute level MACD on August 1st, 2022:
https://api.polygon.io/v1/indicators/macd/TSLA?timespan=minute×tamp=2022-08-01&adjusted=true&short_window=12&long_window=26&signal_window=9&series_type=close&order=desc&apiKey=*
We've also introduced a new series_type query parameter. This is used to determine which price in the underlying aggregate will be used to calculate the indicator. For example, requesting a 20-day SMA with “series_type=open”, each SMA value returned will be calculated using the open price from the previous 20 daily aggregates, including the current one. This parameter defaults to 'close'.
When a user requests an indicator, we determine which aggregates are needed to create the requested indicators and request those aggregates. We then make a separate series of prices using the requested series_type, i.e., open, high, low, or close. We calculate the requested indicator for each relevant time period. For example, if the requested range contains a period where the market is closed, we don't compute values for those times. If the range is missing aggregates where we expect to have aggregates, we impute the missing price values by forward-filling using the previous aggregate.
For example, here's a request for the 10-day SMA data over the period [2022-08-15, 2022-08-19] using close prices for AAPL:
https://api.polygon.io/v1/indicators/sma/AAPL?timestamp.gte=2022-08-15×tamp.lte=2022-08-19×pan=day&window=10&series_type=close
To satisfy this request, we request 9 days worth of previous aggregate data, up to the upper limit: 2022-08-01 to 2022-08-19 (Notice that we’re looking back on ten market-open days, not ten calendar days). We then make sure we have all the aggregates required and impute missing data points if need be. Then we make a series using the close prices of each aggregate. From this series, we calculate our SMA values and return them.
It is important to note that this API’s limit parameter works in conjunction with our pagination logic. One aggregate request is made for each query for indicator data, meaning there may be a disparity between the results returned and the limit provided. For example, here’s a request for the SMA with an hour timespan, with a window of 50:
https://api.polygon.io/v1/indicators/sma/AAPL?timespan=hour&adjusted=true&window=50&series_type=close&order=desc&limit=5000
Because we are essentially requesting 50 hours of aggregates to derive SMA, the Aggregate API’s limit of 50k is reached before the end of the entire window. Our pagination logic ensures that all results are captured; however, they will be on different pages. The first page of results are all of the SMA values that can be created from that first 50k window, and the next_url will lead to the next set of values up until that set limit. Your entire request will be fulfilled, but pagination may be required.
We've decided to include our Technical Indicator APIs for free with all polygon.io subscriptions. All rate limits and historical boundaries will still apply to the respective subscription levels.
We're excited to hear how you make use of these new APIs!
If you have any questions, concerns, or feedback about these new APIs, feel free to shoot a message to support@polygon.io, or join our slack channel via the invite prompt in your dashboard.
-Polygon Team
p.s. Come help build our next set of APIs: polygon.io/careers