Tickblaze is one of the world’s most advanced platforms for professional quants and active traders. Armed with a modern, sleek, and customizable interface, terabytes of historical data and a robust API for developing trading strategies, they’re taking on the most sophisticated trading platforms. Tickblaze is setting the new standard for automated trading software, and they’re backed by world-class financial market data from polygon.io.
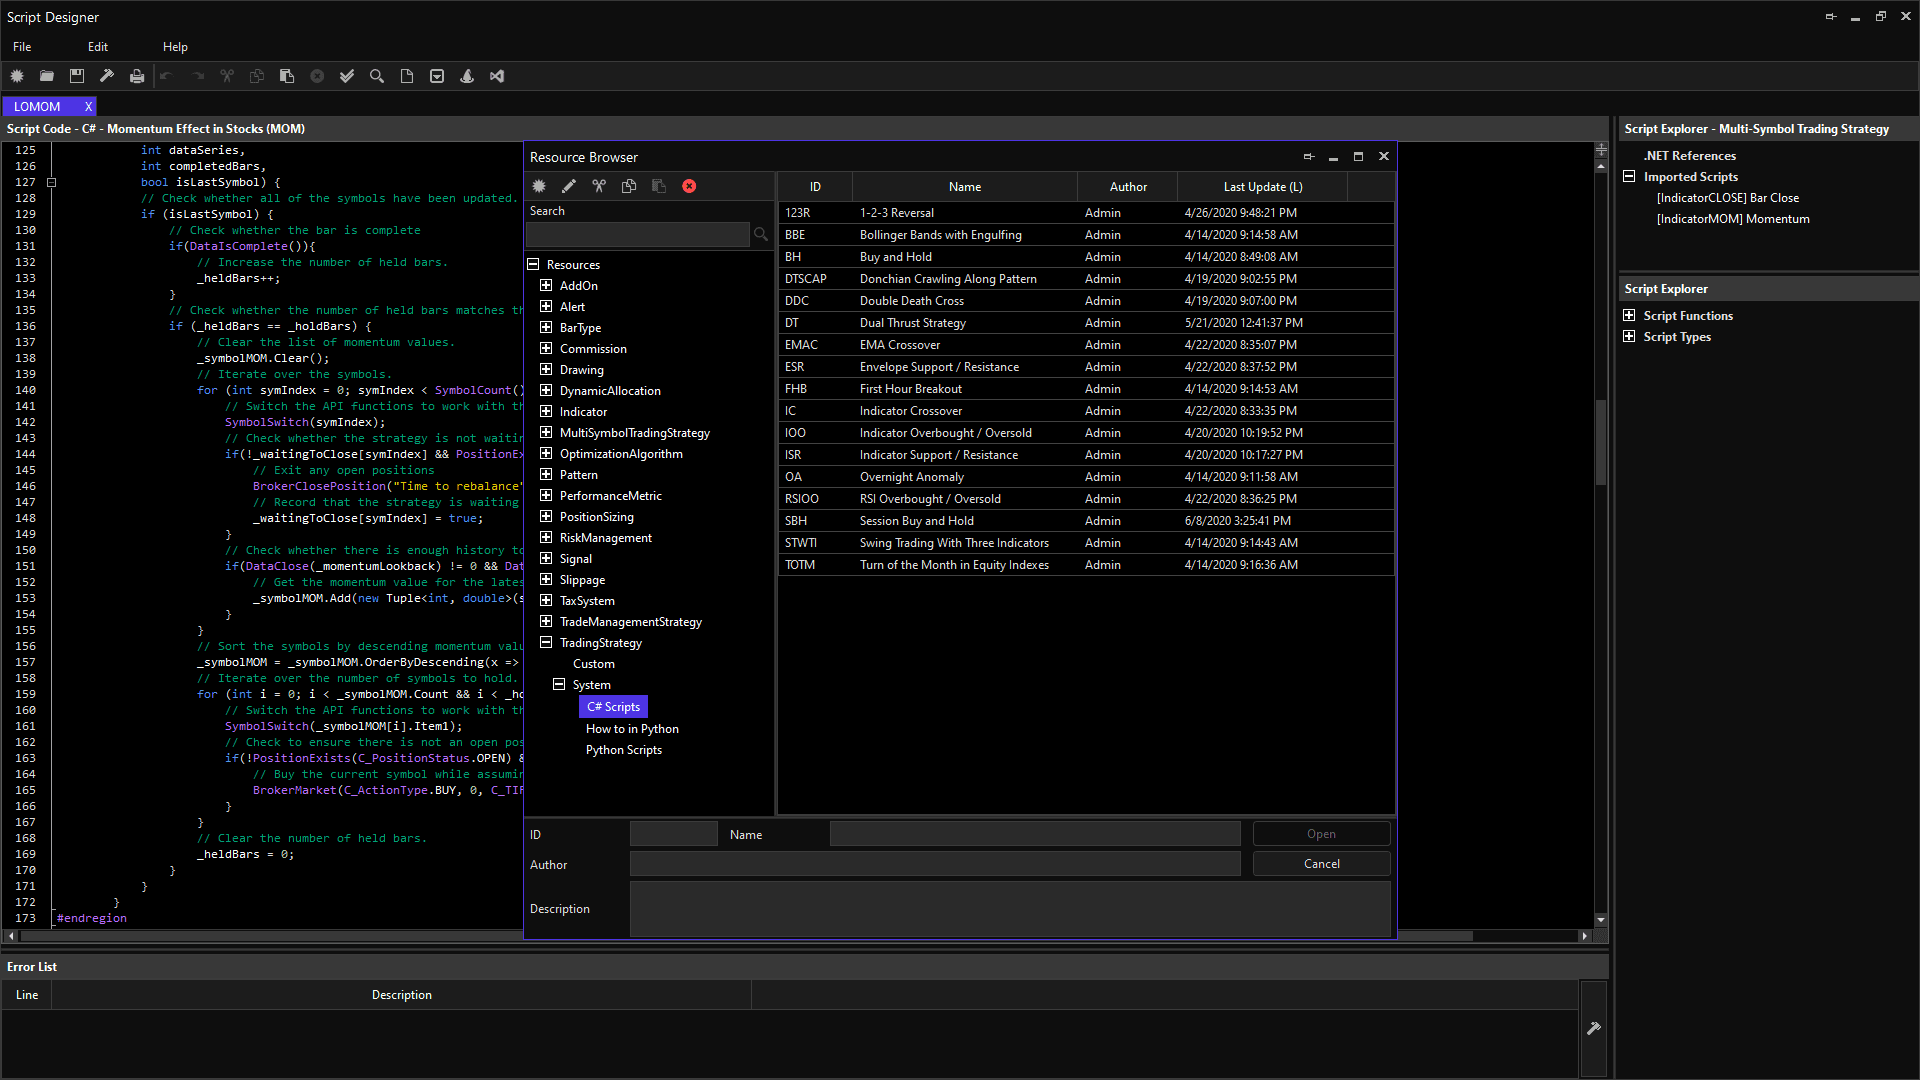
Tickblaze is a desktop platform that allows quants to design trading strategies in C# and Python using an integrated IDE, or Visual Studio. The platform’s backtesting and automated trading capabilities are built on top of 18 different types of scripts that extend the platform and can be powered by polygon.io.
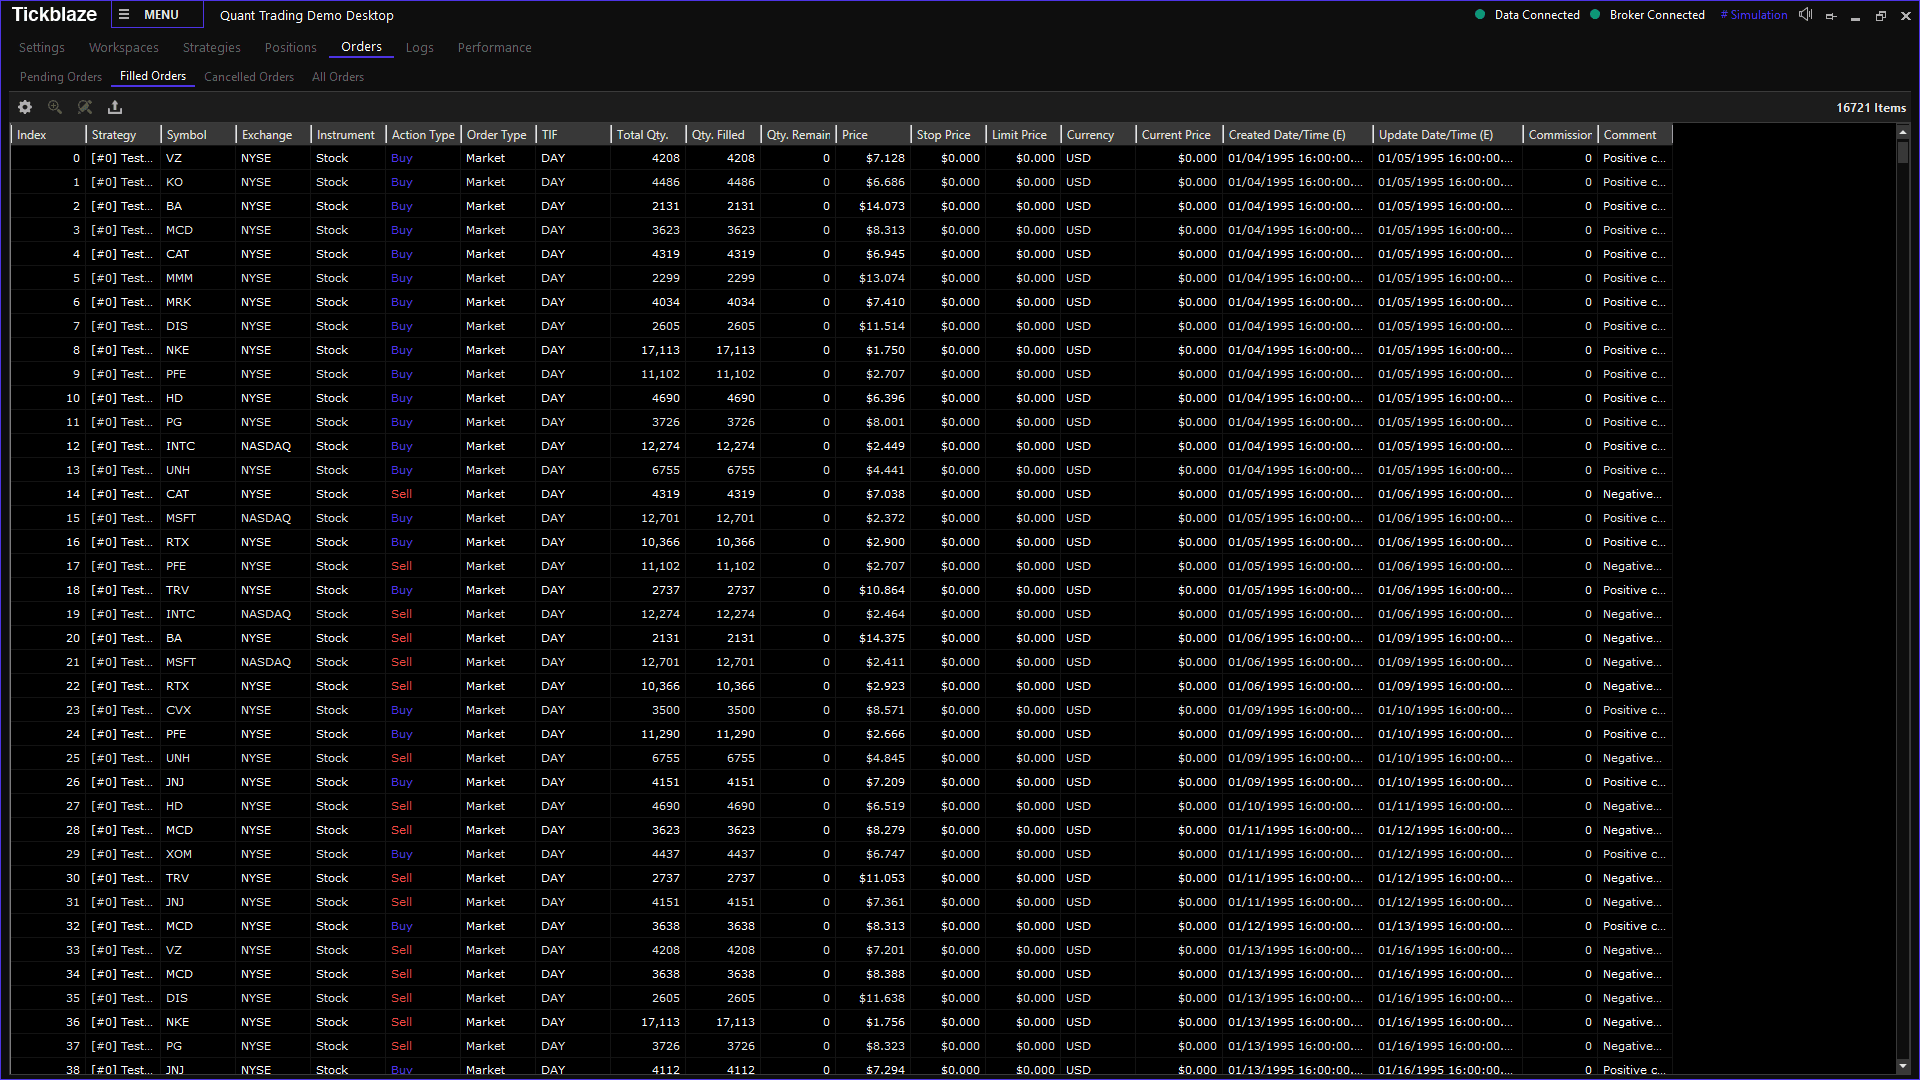
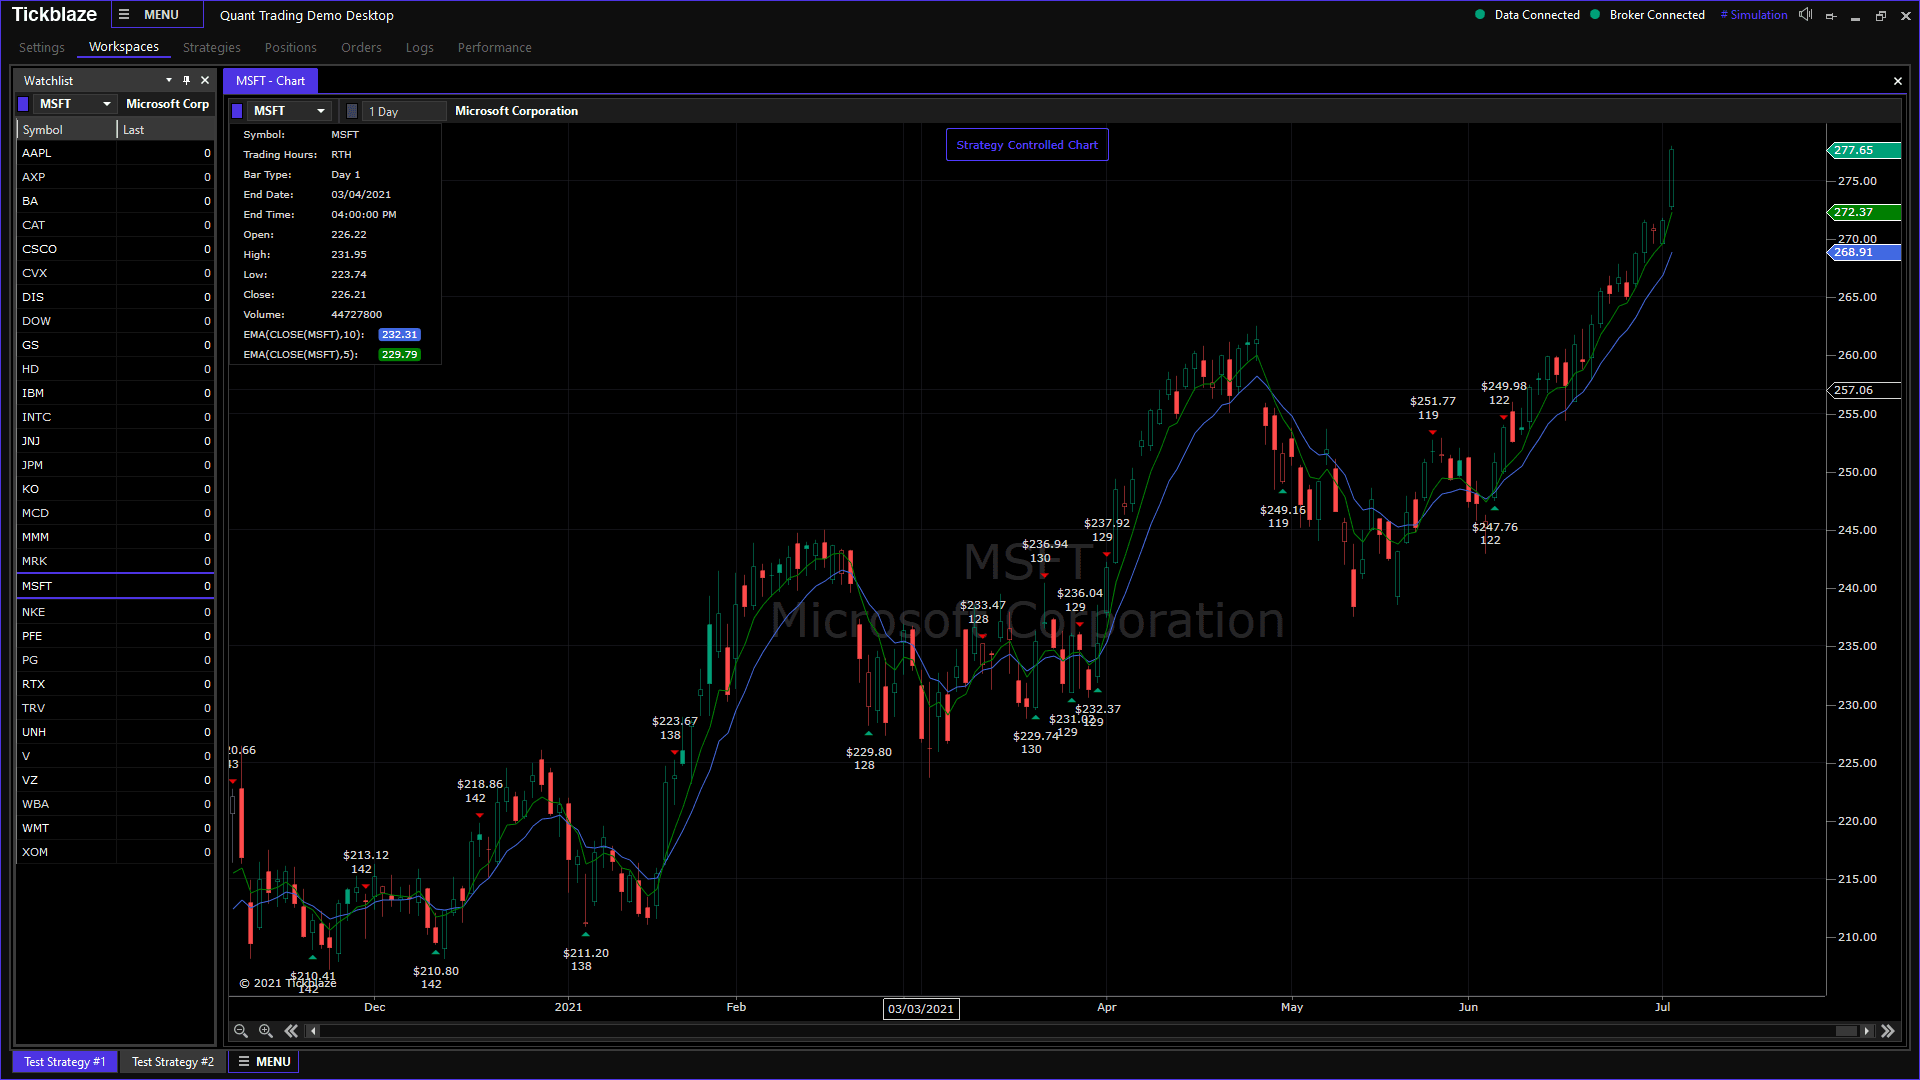
Quants can use Tickblaze and polygon.io to design, backtest and execute a portfolio of trading strategies, either on their own local workstation or on the cloud. Each strategy in the portfolio is assigned a trading strategy script, an underlying bar interval, and one or more symbols. Tickblaze can backtest and trade both standard and exotic bar intervals, including ticks, minutes days, renko, range, and many others.
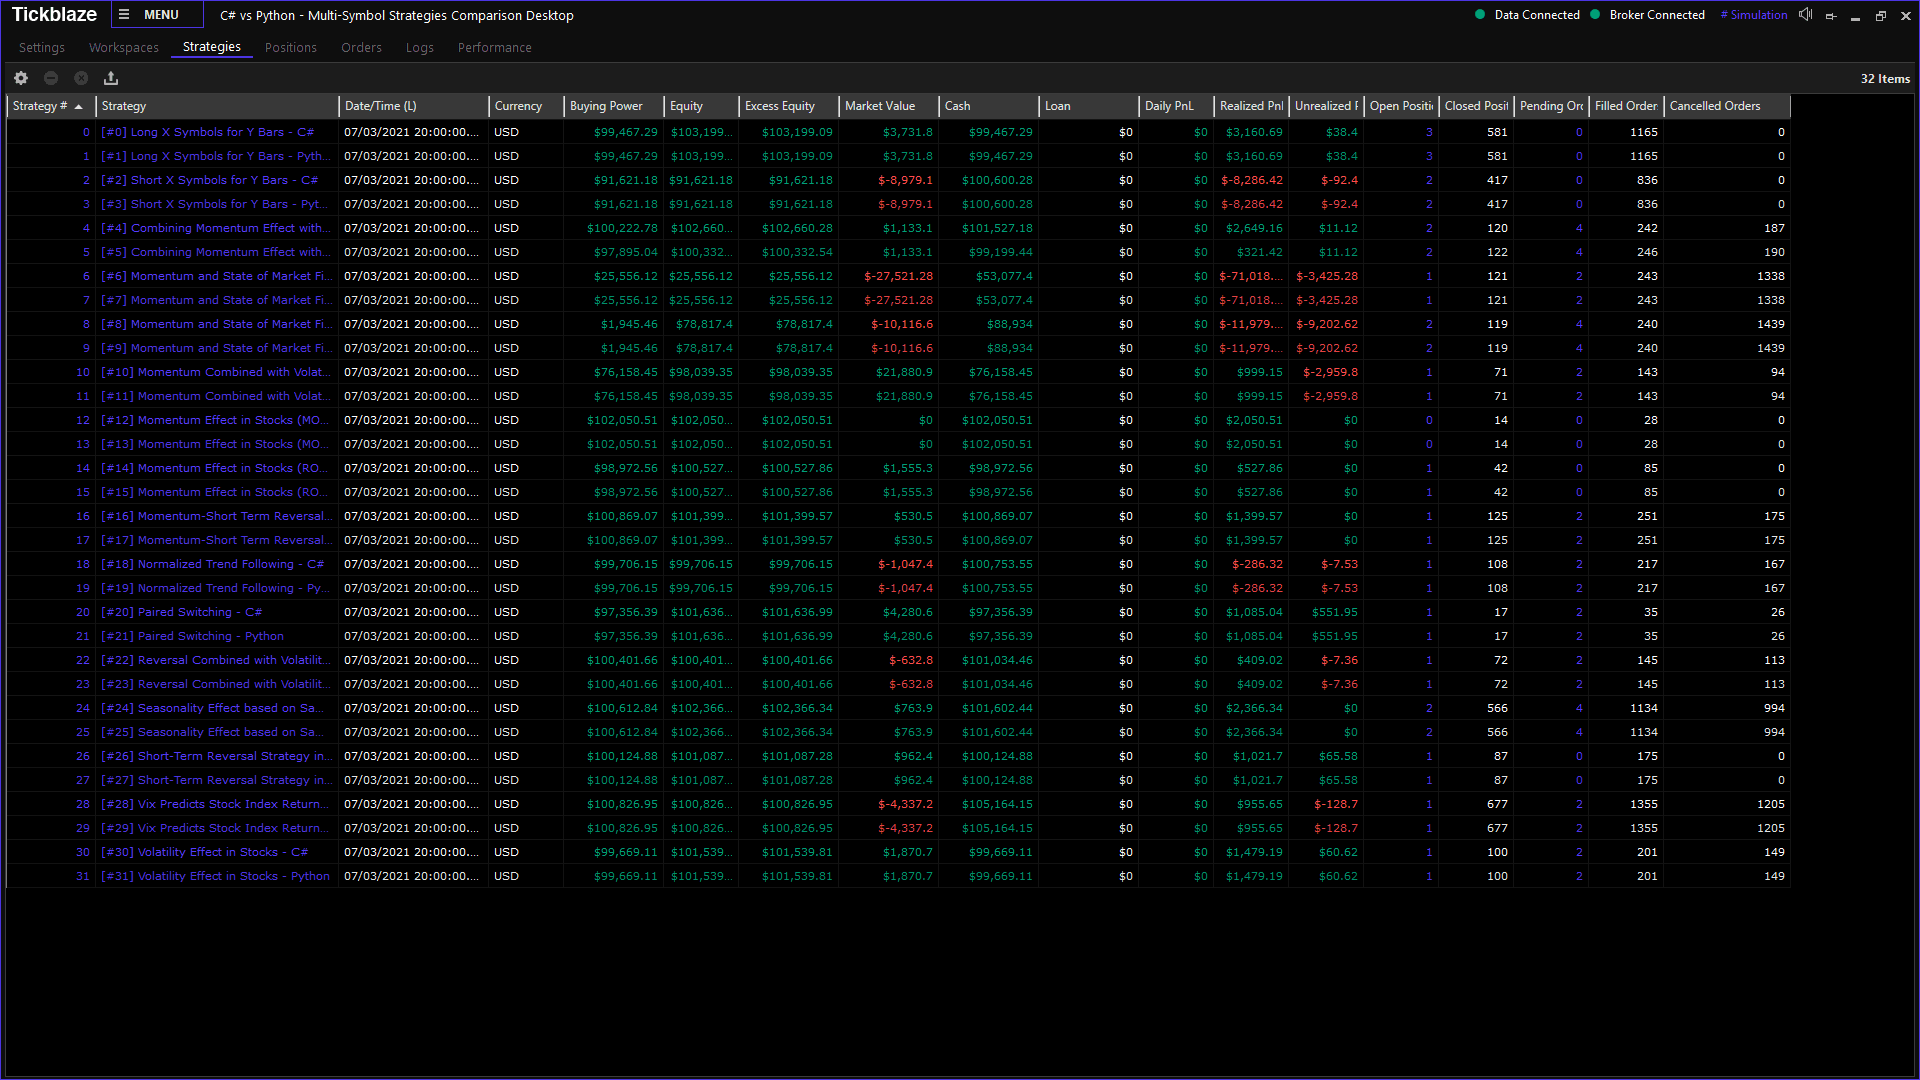
Tickblaze is unlike any other automated trading software out there, as it allows you to simultaneously backtest multiple strategies such that each strategy can trade multiple symbols, asset classes, bar intervals, and exchanges all at the same time. Now you can finally model your entire portfolio of strategies in a single integrated environment for both backtesting and automated trading. Also, since Tickblaze is a desktop platform you can rest assured that your strategies are kept privately on your own workstation and away from prying eyes.
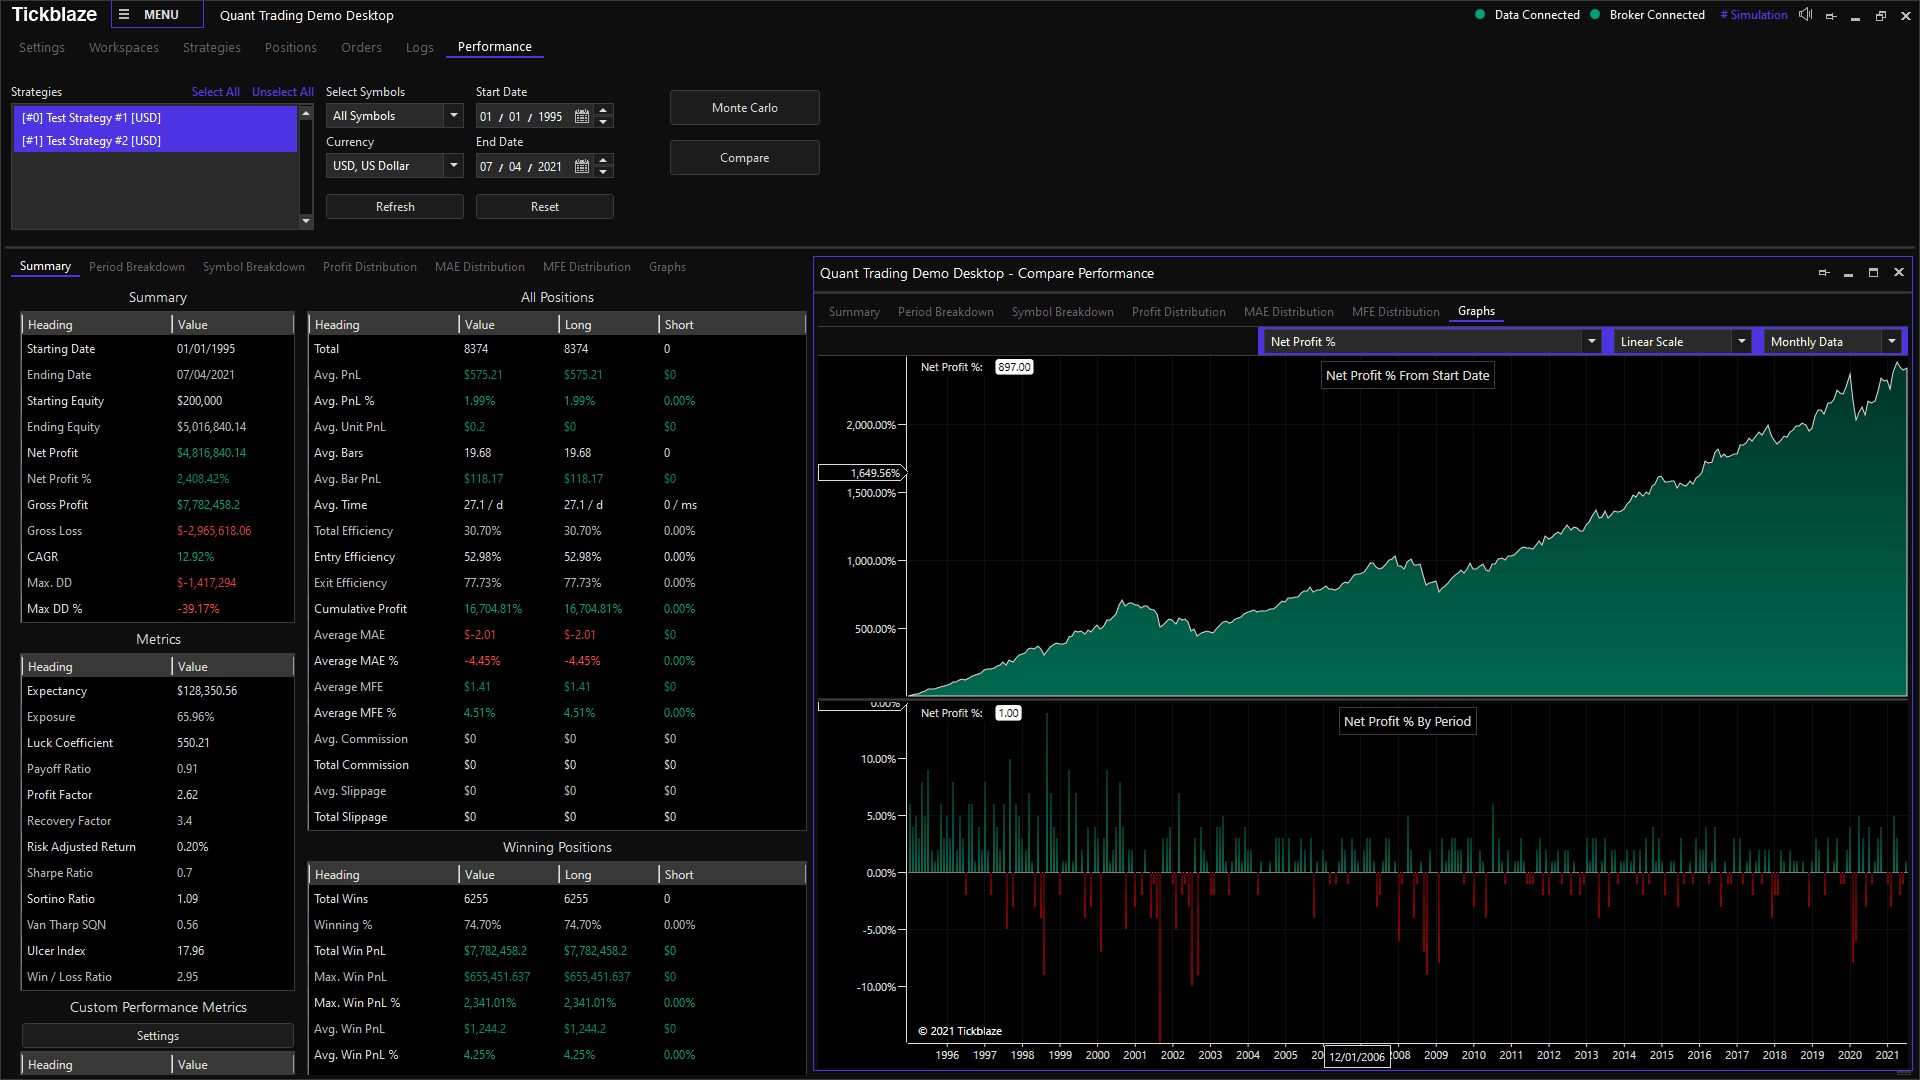
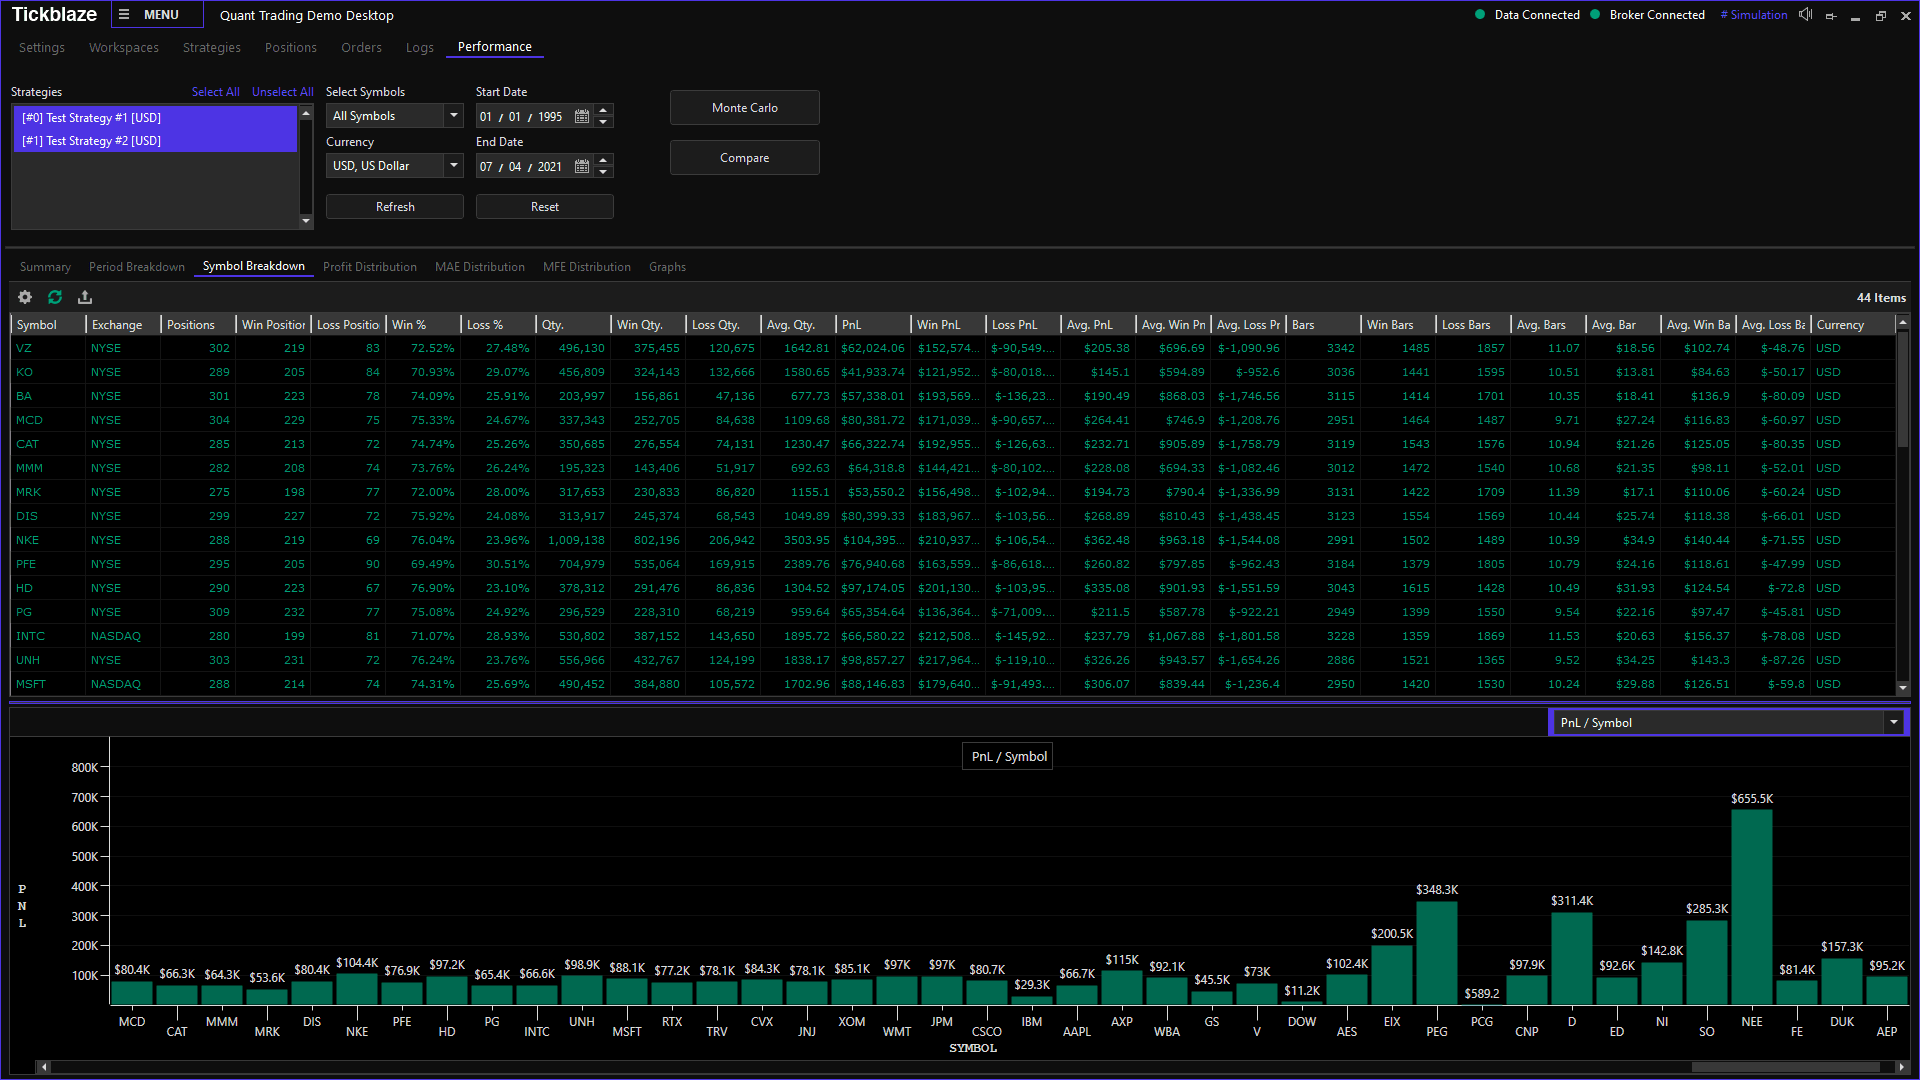
Backtest Summary Interface
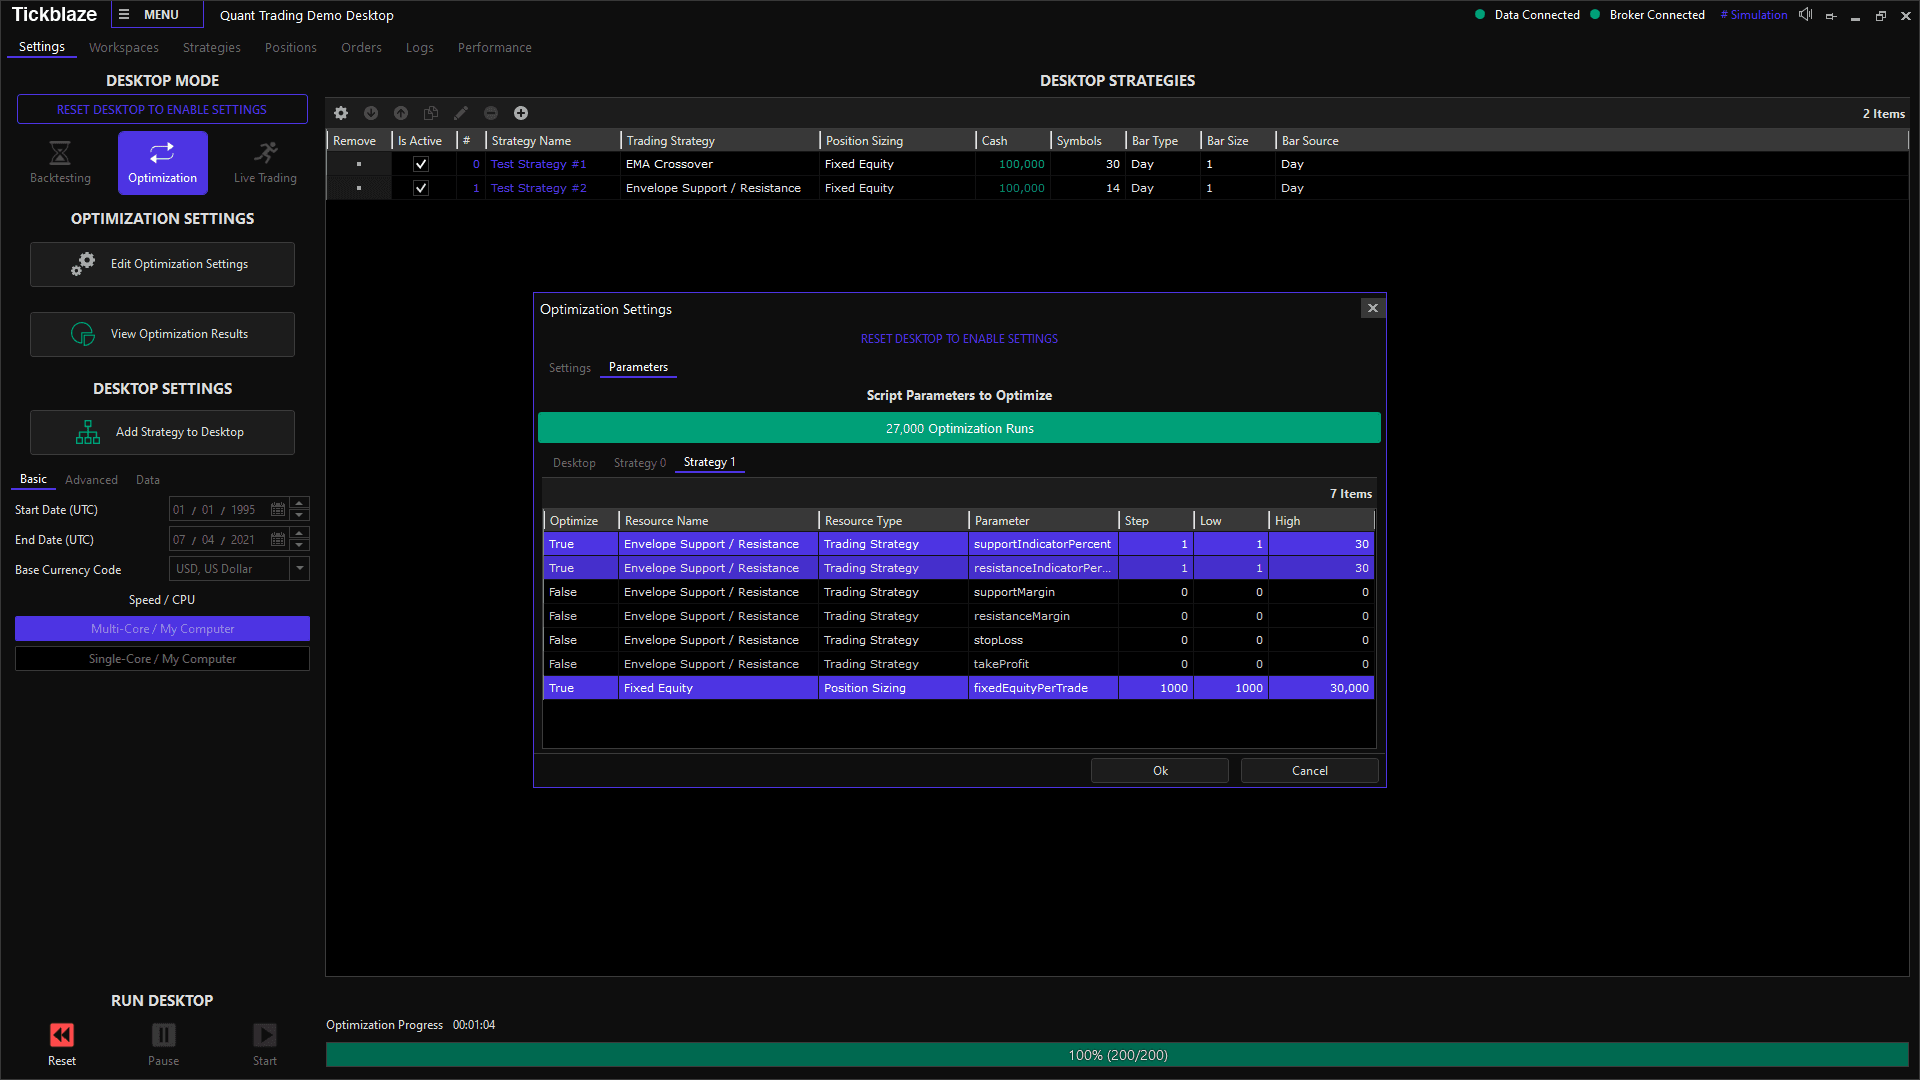
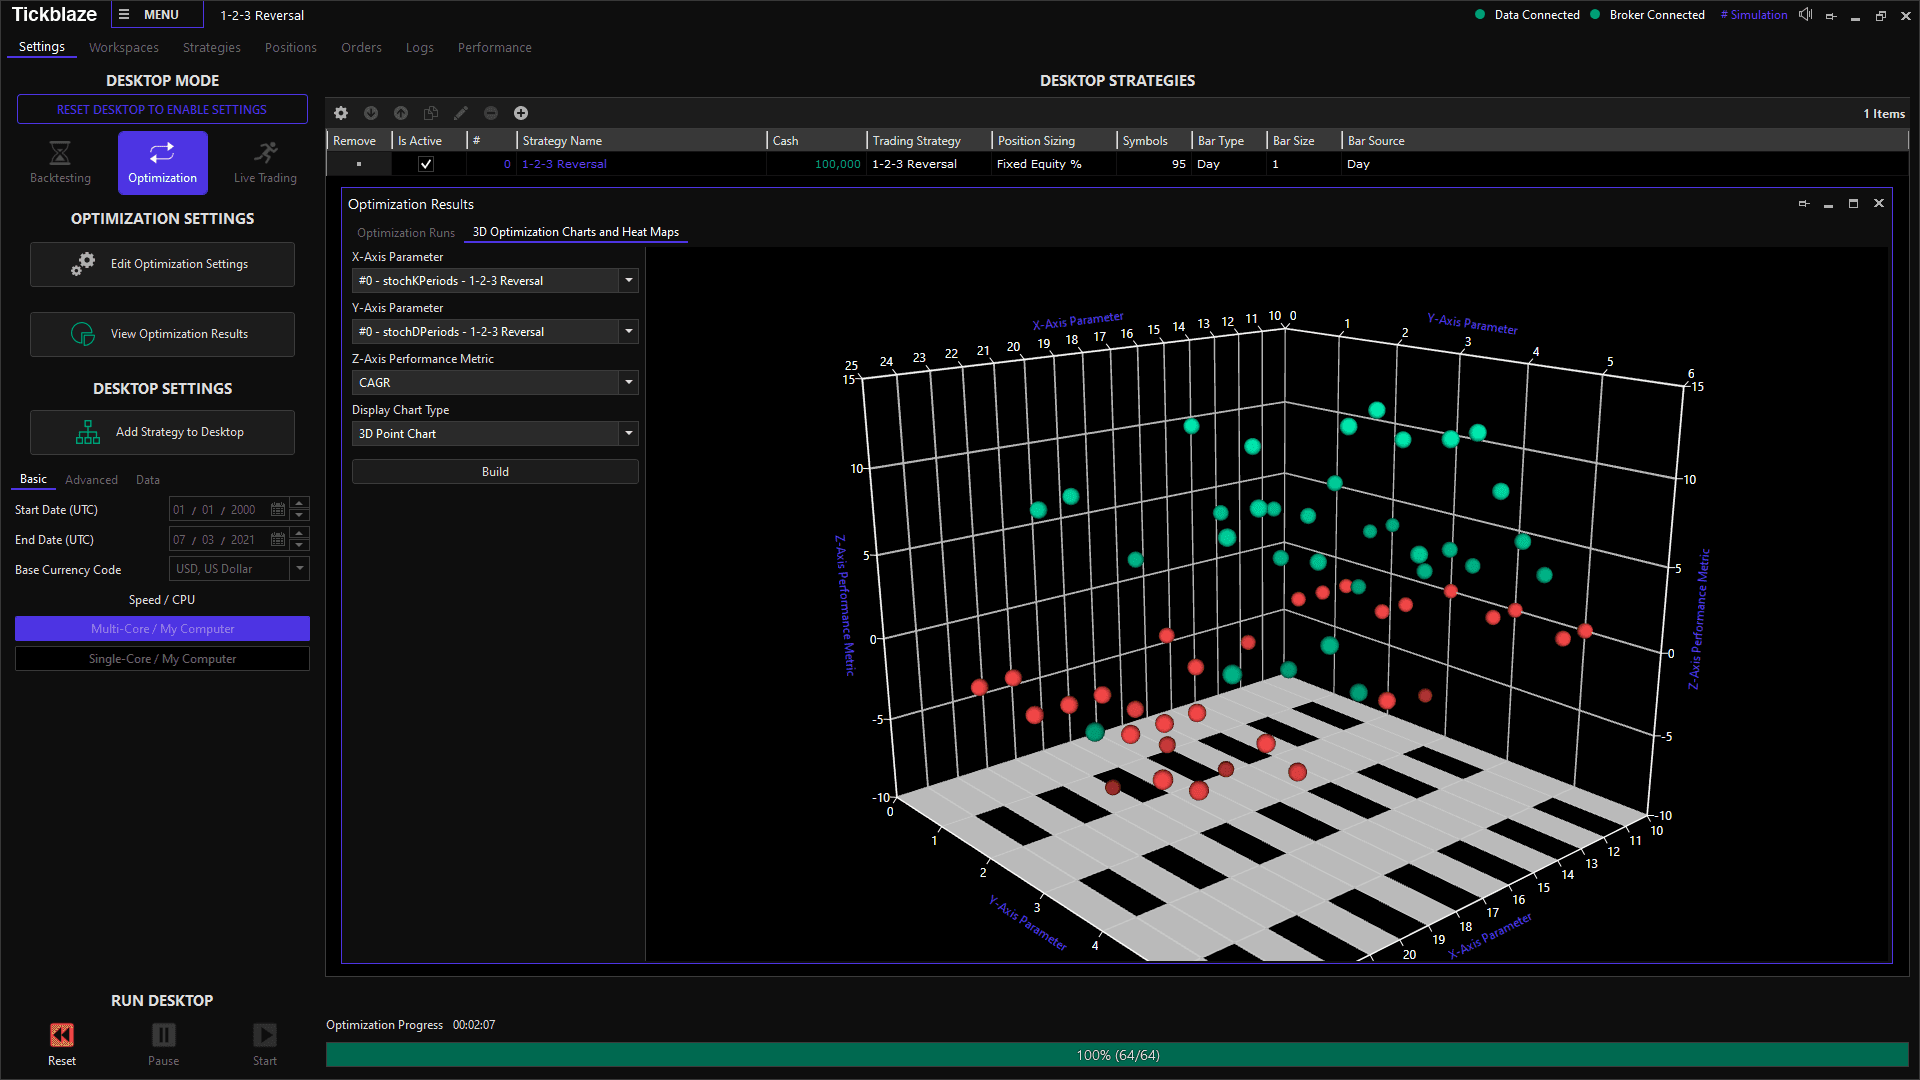
Tickblaze’s unique architecture enables you to not only backtest a portfolio of strategies but also to optimize one as well. This means that Tickblaze can automatically backtest your strategies again and again while tweaking script parameters until their optimal values are found.
Optimization Settings interface
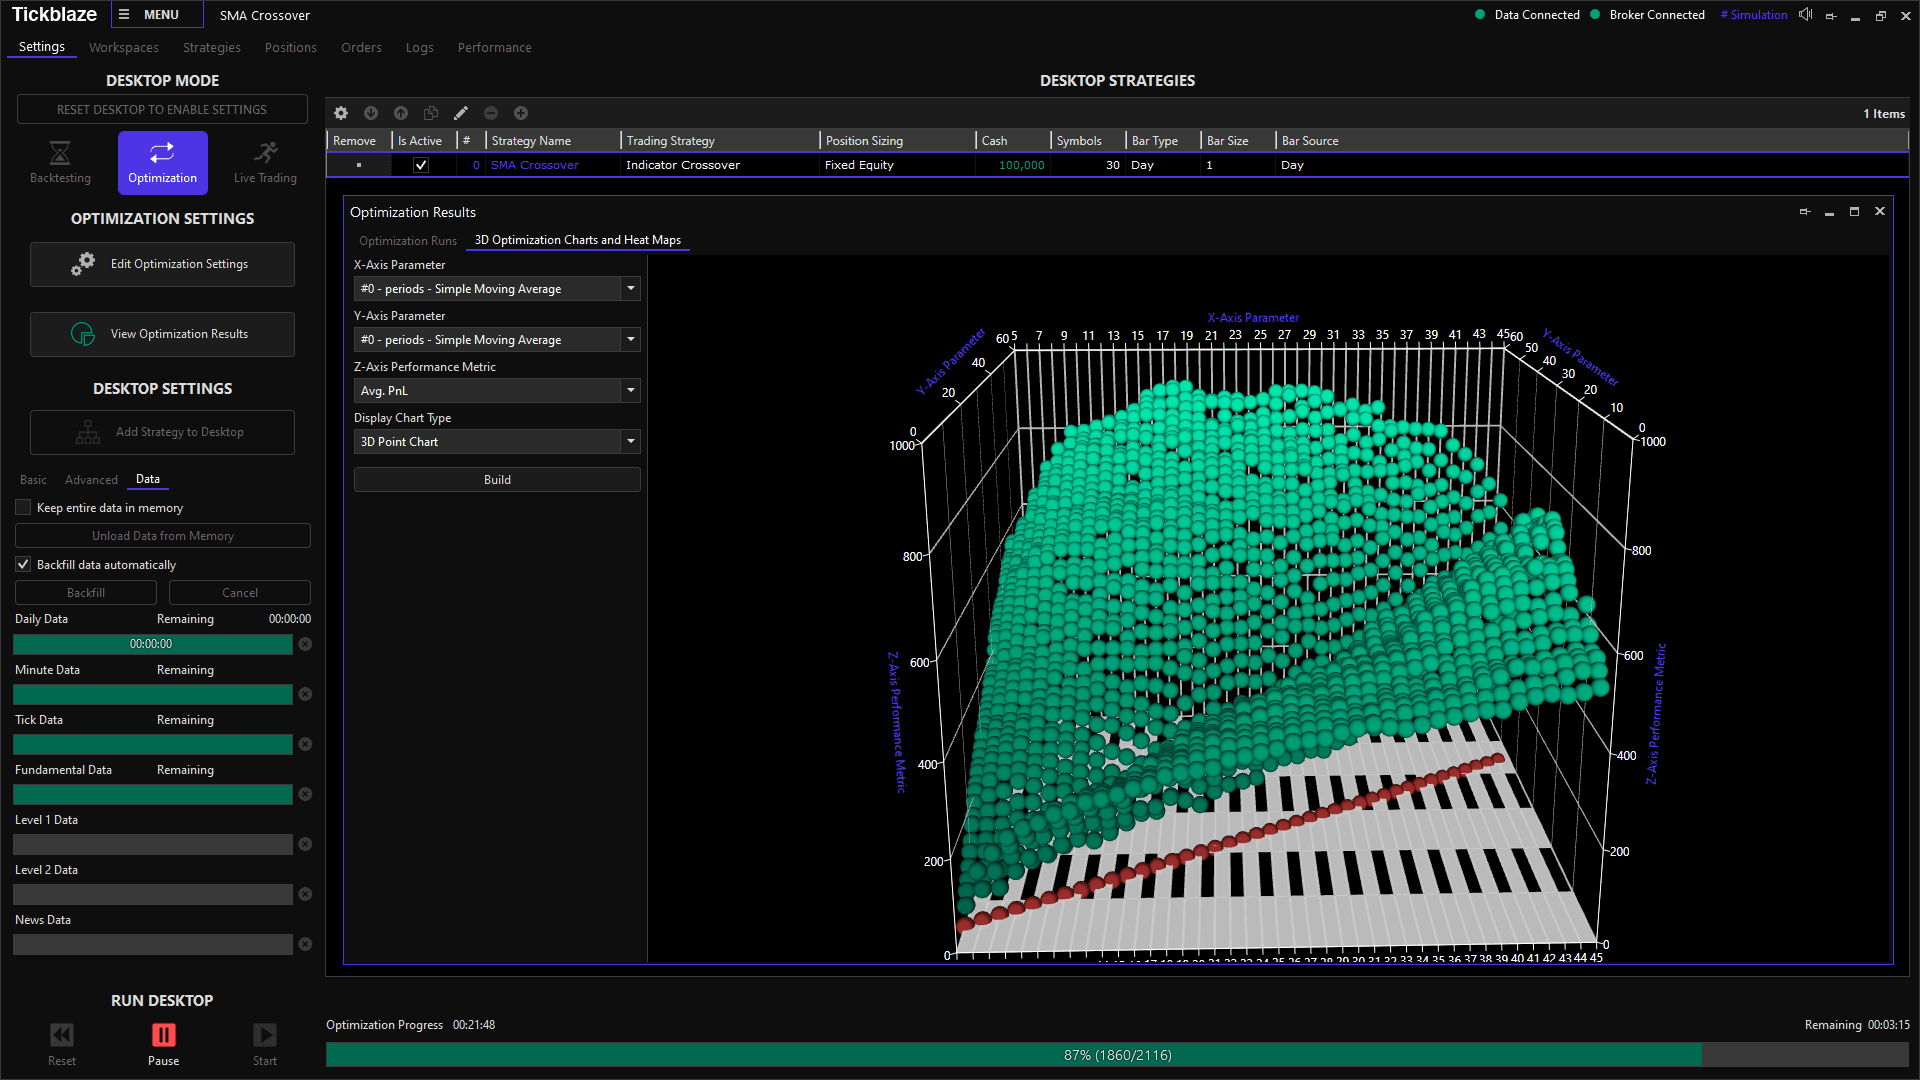
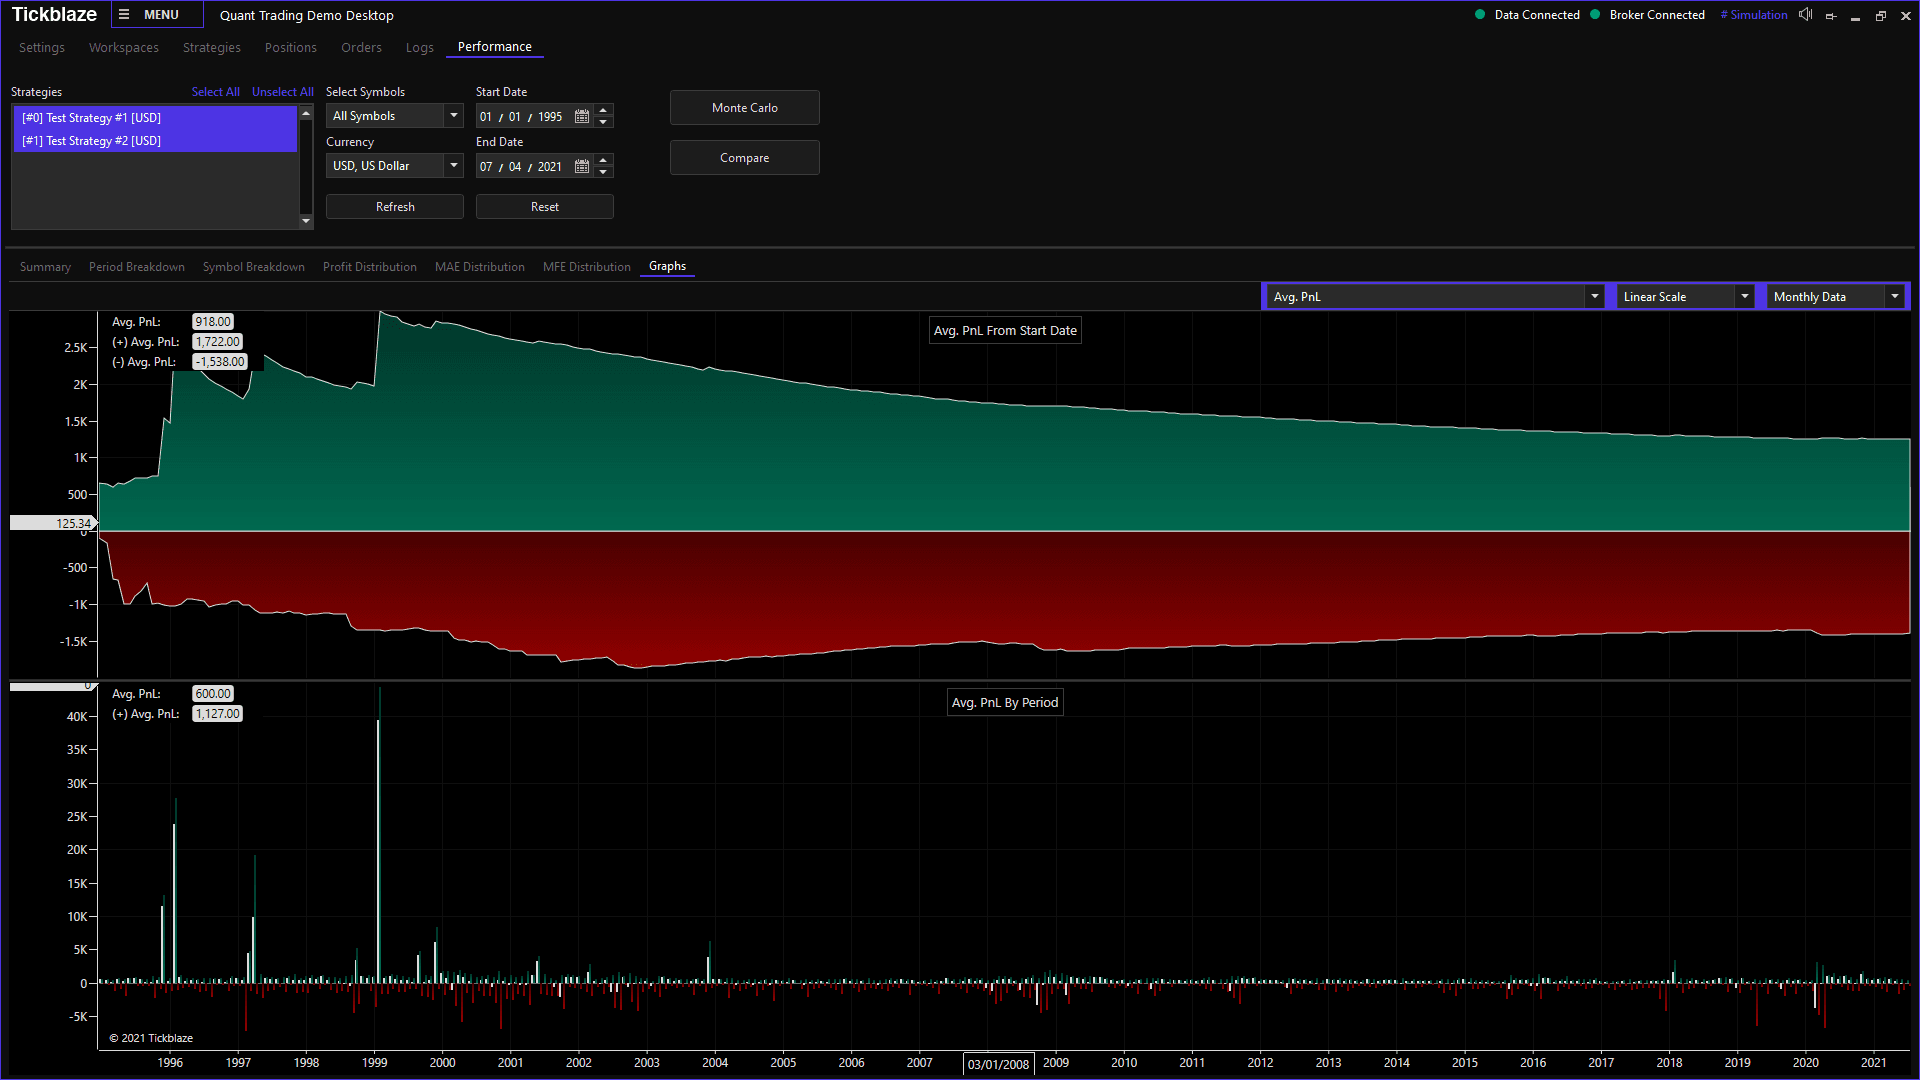
The platform is also equipped with advanced visualization tools which provide insight into the performance of your trading strategies. These include an extensive performance summary, multiple breakdowns, and dozens of charts, in addition to 3D optimization graphs and heat maps.
Performance of a strategy optimization, visualized in real-time using a 3D Point Chart
After you’ve backtested and optimized your strategies, you can switch your portfolio to live trading mode and have it traded with your favorite brokerage provider.
Because Tickblaze is tightly interwoven with our market data APIs, we are happy to announce that all Stocks Developer subscribers will be able to access an enhanced version of Tickblaze’s Community Edition product. Normally, the Community Edition will only allow EOD data to be analyzed, however, our Stocks Developer users will be able to backtest strategies on top of polygon.io intraday data, as well as access the Simulation Mode using our WebSocket feed. Also, all asset classes will be supported.
It is very unlikely that you will find a more robust platform with no backtesting limitations, for free, anywhere else.
To claim this offer, use the same email address to sign up for Tickblaze that is registered with polygon.io.
Polygon.io is excited to announce a new partnership with Benzinga, significantly enhancing our financial data offerings. Benzinga’s detailed analyst ratings, corporate guidance, earnings reports, and structured financial news are now available through Polygon’s REST APIs.
This tutorial demonstrates how to detect short-lived statistical anomalies in historical US stock market data by building tools to identify unusual trading patterns and visualize them through a user-friendly web interface.