Building a Unix top-inspired Tool to Monitor the Stock Market in Real-Time
Sep 15, 2023
In this tutorial, we will build a Python tool inspired by the Unix top command to monitor real-time stock market trades using Polygon’s python-client library. We will start by connecting to Polygon's stocks websocket server, then subscribe to a continuous stream of trades, covering all stocks, across the entire US stock market. The tool will show trade activity in 5-second intervals, maintaining running totals, and sorting tickers by trade volume. This tutorial provides a hands-on experience, dives into the mechanics of market data websockets and walks through a workflow for processing and visualizing real-time streaming data.
Below, we will explore the construction process step-by-step. But if you are eager to jump right in, here's the completed script for you to try out. You will need an active subscription with Polygon for the Stocks Developer or Stocks Advanced to run it, as we will be streaming trades.
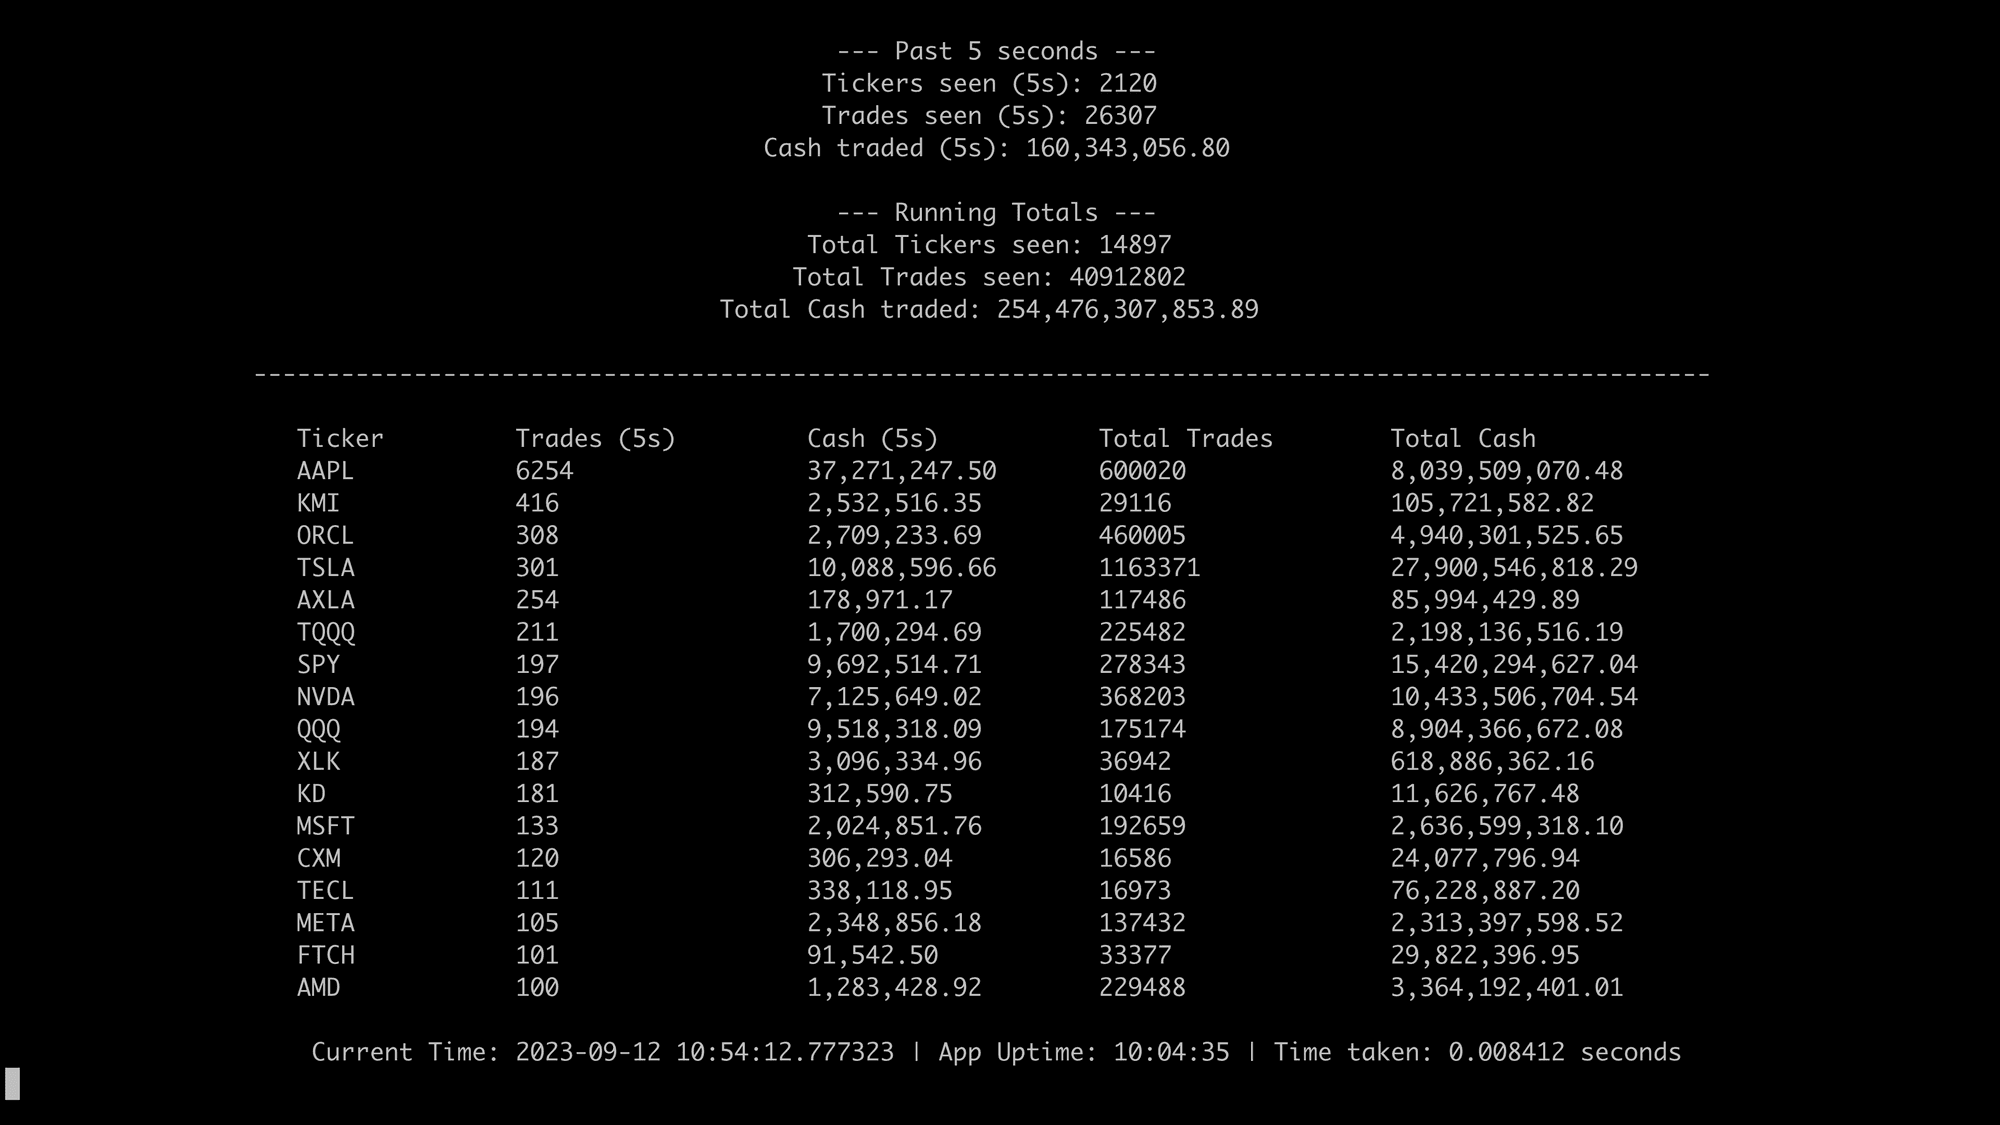
AAPL's trading frenzy: 6,254 trades in just 5 seconds during the iPhone 15 release event on September 12, 2023.
Polygon is a financial data platform that provides both real-time and historical market data for Stocks, Options, Indices, Forex, and Crypto. With access to this information, developers, investors, and financial institutions can gain valuable insights and make informed decisions.
Getting Started
Polygon's Stocks WebSocket API provides both real-time and 15-minute delayed stock market data from all US stock exchanges. This data can be aggregated down to the minute or second and offers both trade and quote subscriptions.
Creating a real-time data tool, especially one that receives a high volume of trades events, involves a fairly universal workflow for how you want to build it, in that you want to connect, subscribe, use multi-threading, task queues, etc, so that you handle messages in a non-blocking way. Exploring this workflow can provide us with valuable insights and is a great was to learn by example.
First, we'll need to install the Polygon.io python client:
pip install -U polygon-api-client
For our purpose, we will tap into a live stream of all trades across the entire US stock market to get a big picture view of what is happening at any given moment. Having access to streaming data is essential for developers and algorithmic traders because it opens all types of use-cases for tracking price movements, making real-time decisions, researching trade patterns, and executing trade-based algorithms.
To kick things off, let's set up a basic subscription to receive all market trades, using the
T.*
parameter:
from polygon import WebSocketClient
from polygon.websocket.models import WebSocketMessage
from typing importList# Connect to Polygon.ioclient = WebSocketClient()
# Subscribe to all tradesclient.subscribe("T.*")
defhandle_msg(msgs: List[WebSocketMessage]):for m in msgs:
print(m)
# Print messagesclient.run(handle_msg)
Running the above code will flood your console with trade data. While this raw output can be an overwhelming firehose of data, it is also a goldmine for tasks like custom aggregations, pattern detection, or building your own tools. As we will explore next, let's turn this stream of trades into a tool to pinpoint the most actively traded stocks across the entire market in real-time.
Handling Incoming Trades
As data flows into our tool, we need to update the logic within the
handle_msg
function to process trade messages, capturing both recent activity (from the last 5 seconds) and the total activity since the tool's initiation. For every trade message, the function increments the trade count by stock symbol and calculates the cash value of the trade. It then updates both the recent and cumulative totals for the number of trades and their associated cash values. With this revised logic, we're equipped to monitor and report real-time trading activity.
This is accomplished by:
defhandle_msg(msgs: List[WebSocketMessage]):global cash_traded
global total_tickers_seen, total_trades_seen, total_cash_traded
for m in msgs:
ifisinstance(m, EquityTrade):
# Update total trades and cash for the past 5 secondsifisinstance(m.symbol, str):
string_map[m.symbol] = string_map.get(m.symbol, 0) + 1 total_string_map[m.symbol] = total_string_map.get(m.symbol, 0) + 1# Update cash tradedifisinstance(m.price, float) andisinstance(m.size, int):
cash_value = m.price * m.size
cash_traded += cash_value
total_cash_map[m.symbol] = (
total_cash_map.get(m.symbol, 0) + cash_value
)
# Update cash for the past 5 seconds cash_map_5s[m.symbol] = (
cash_map_5s.get(m.symbol, 0) + cash_value
)
# Update totals total_tickers_seen = len(total_string_map)
total_trades_seen += 1 total_cash_traded += cash_value
Data Aggregation and Analysis
With the updated logic for handling trades message we can now aggregate and analyze our data. We need a function that will process and sorts stocks based on their trading activity and calculates their totals. We can refresh our totals every 5 seconds to ensure that the tool isn't just providing data, but always relevant data and hopefully timely insights.
For this code example, we've streamlined the code for clarity and to make it easier to understand. For a detailed look at the complete code, please visit here.
Display and Visualization
Drawing inspiration from the Unix
top
command, we can display our aggregated data into a console-friendly, dynamic leaderboard of most acive stocks ranked by trade activity. This format gives us an at-a-glance view of the market, emphasizing the most active stocks based on their trading frequency along with running totals.
Past 5 Seconds
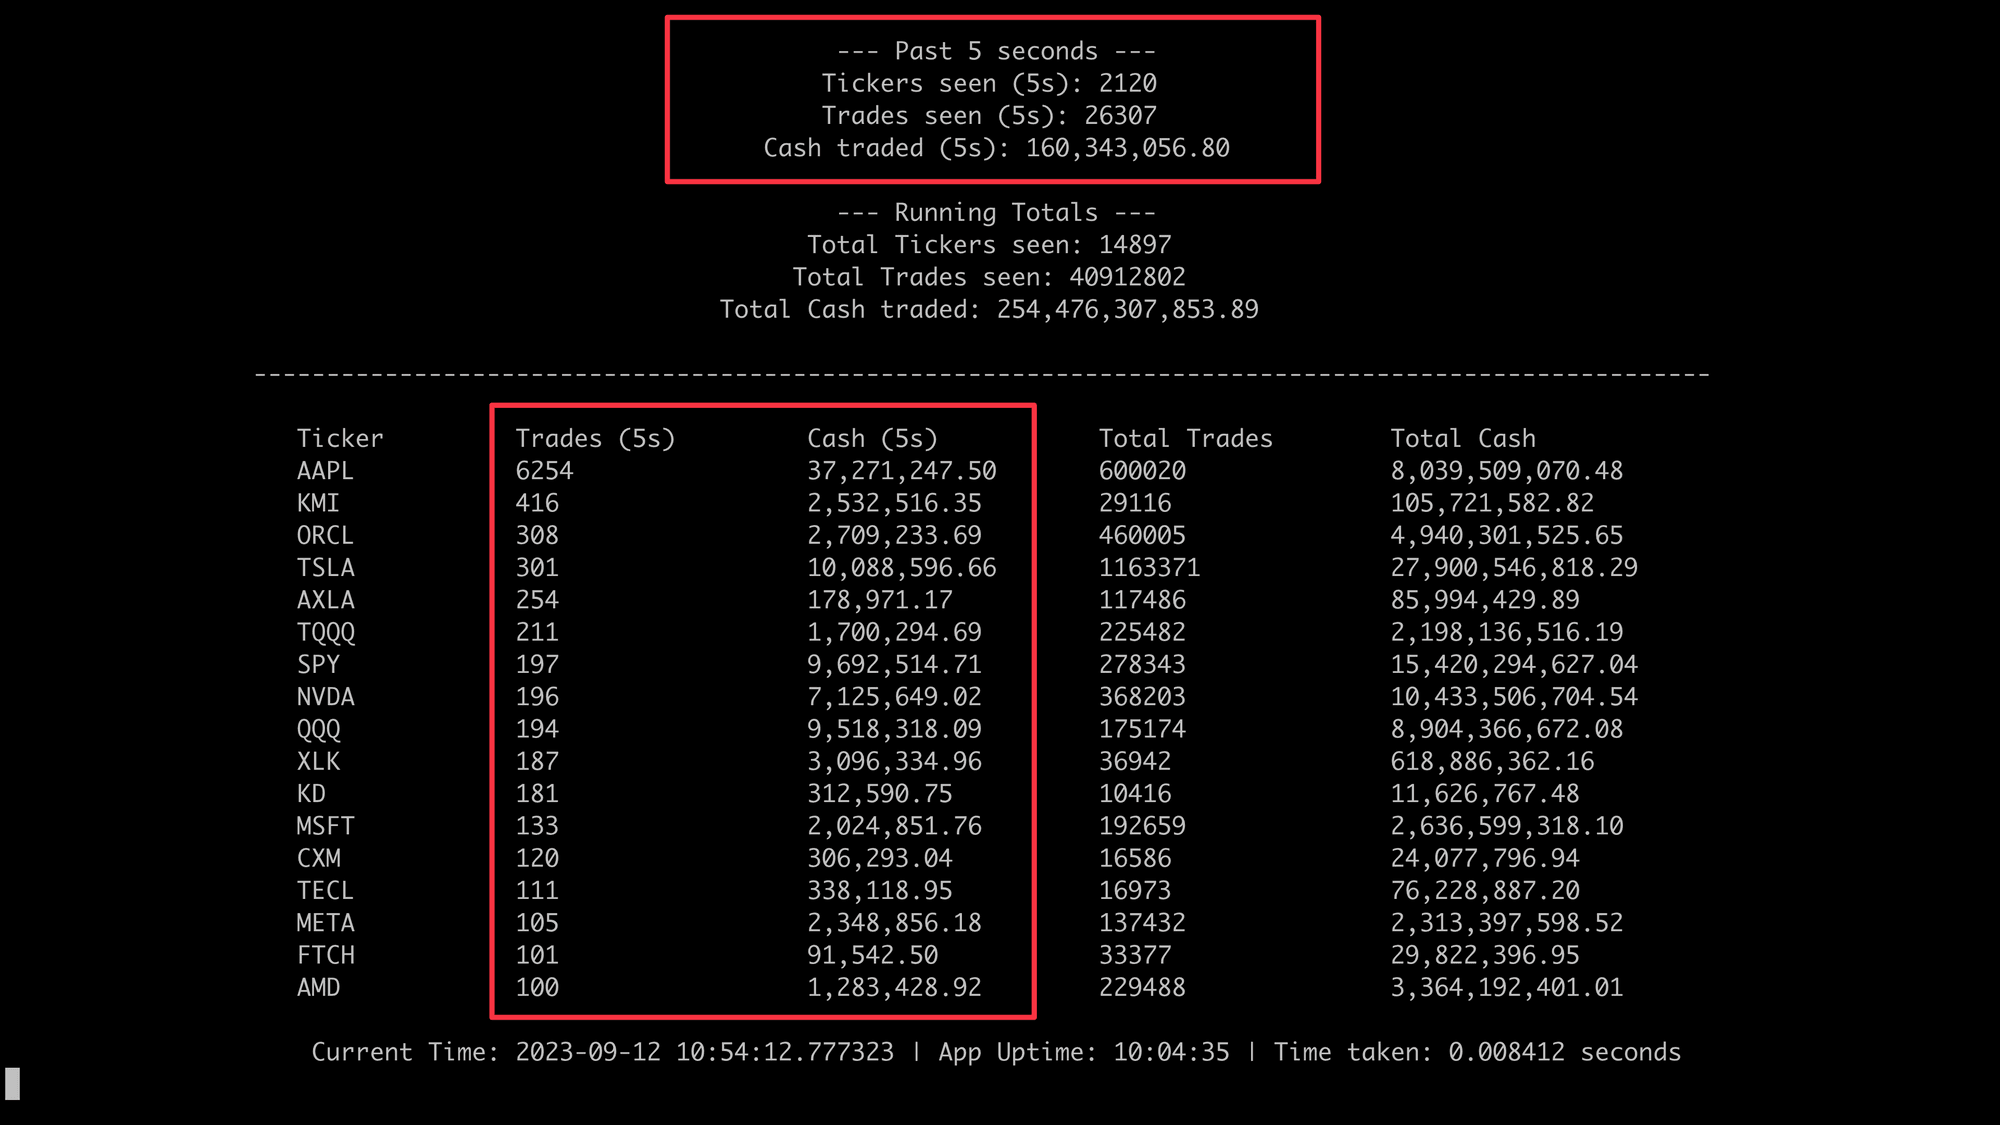
The application provides a snapshot of stock market activity every 5 seconds. This snapshot, termed "Past 5 seconds", details the number of unique tickers seen, the total number of trades, and the cumulative cash value of these trades within that interval. This short-term insight offers a quick glance at the most recent market activity, enabling users to discern sudden shifts or movements in trading volume and cash flow.
Zooming in on the moment: Red boxes spotlight the intense 5-second trading activity across the market.
Running Totals
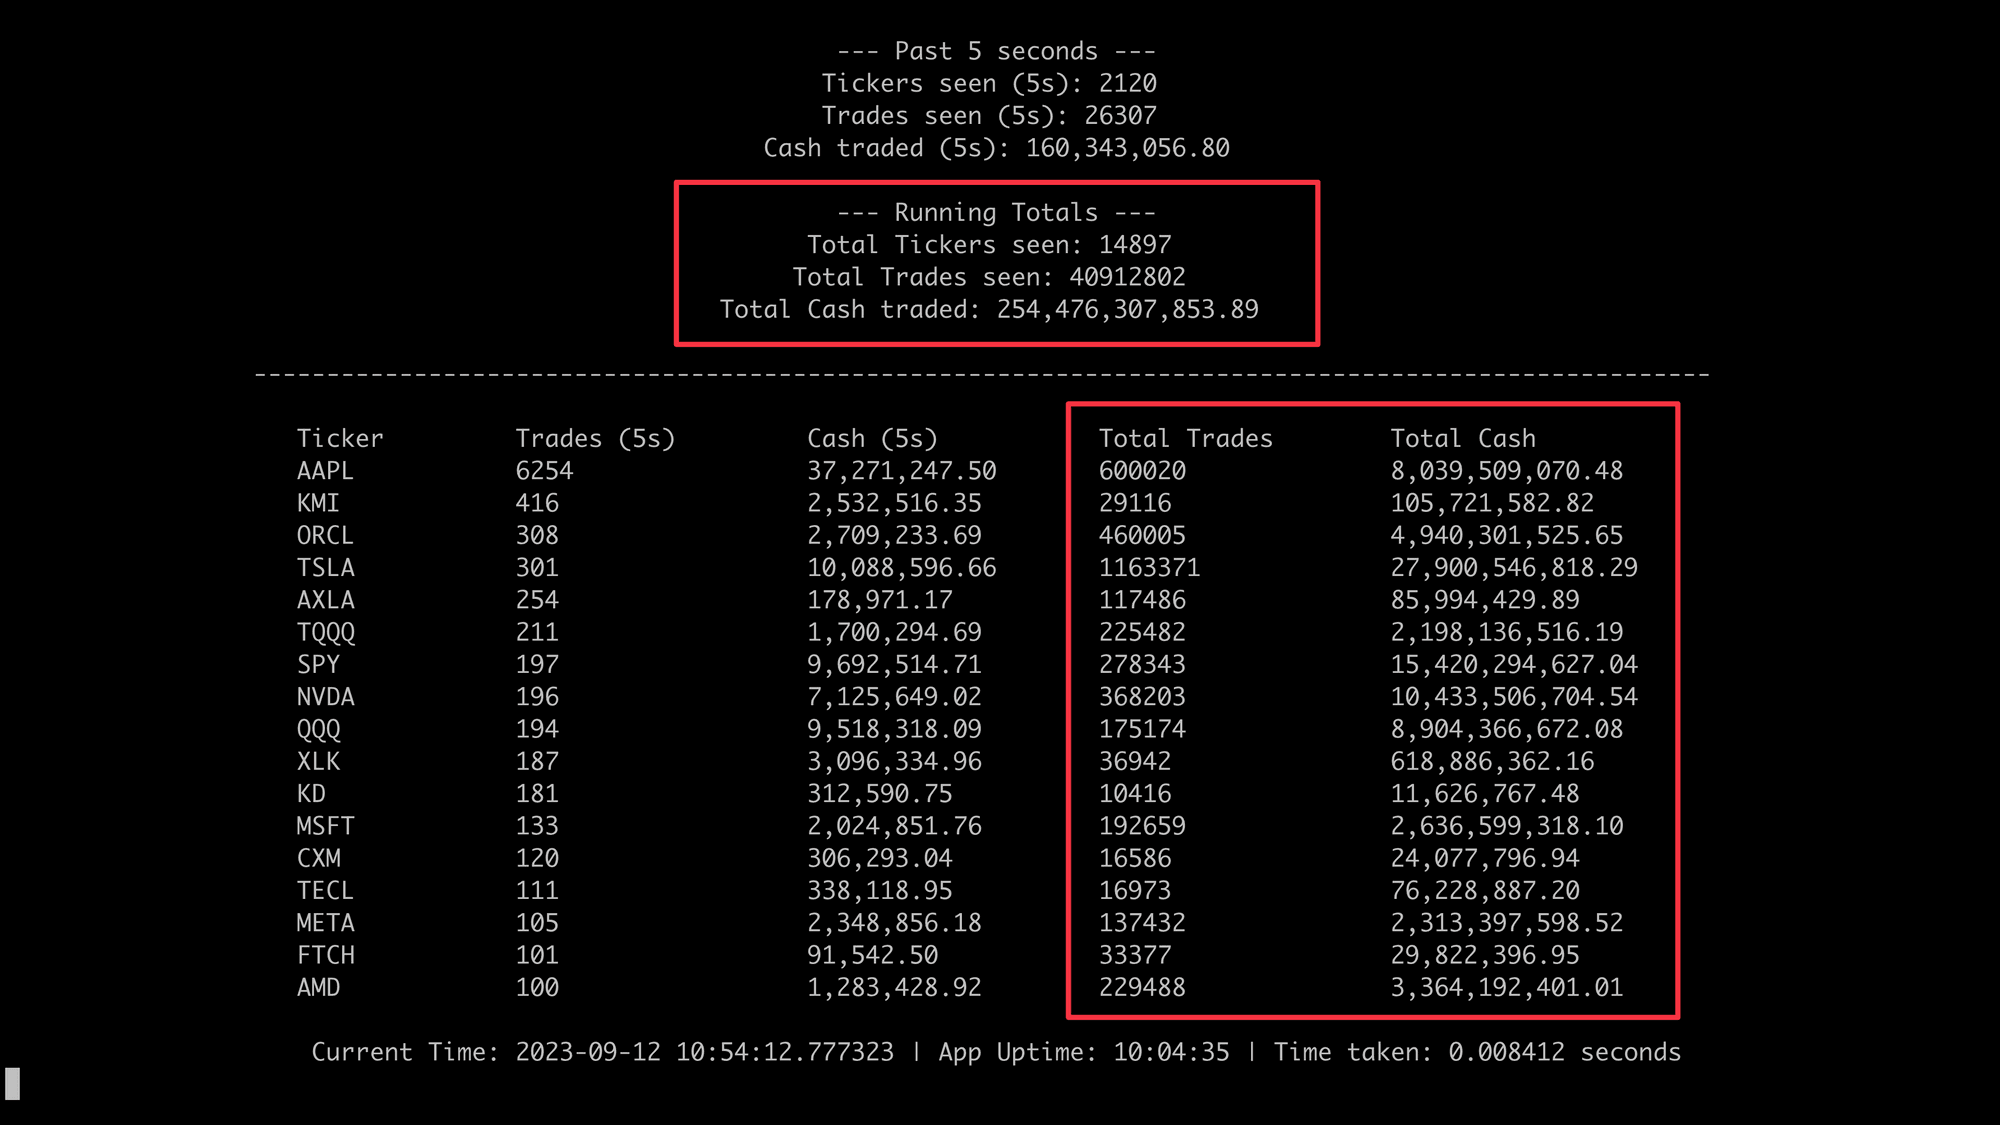
Beyond the immediate 5-second window, the application maintains an ongoing tally termed "Running Totals". This tracks the total number of unique tickers seen since the app started, the grand total of trades, and the cumulative cash value across all these trades. These running totals give users a broader perspective on market activity over time, highlighting the most consistently traded stocks and their cumulative financial impact.
Big picture perspective: Red boxes underscore the cumulative trading activity for the entire market since the application's launch.
Next Steps
Throughout this tutorial, we've demonstrated the construction of a real-time stock market monitoring tool using Polygon.io’s python-client library. Drawing inspiration from the Unix top command, our Python tool processes continuous streams of trade data, offering both snapshots of recent activity and a cumulative view of the broader market trends.
For those interested in exploring further or adapting this code for other applications, the full example script is available here. As the financial market is ever-evolving, tools like these play a pivotal role in keeping investors, developers, and traders informed and ahead of the curve.
Polygon.io is excited to announce a new partnership with Benzinga, significantly enhancing our financial data offerings. Benzinga’s detailed analyst ratings, corporate guidance, earnings reports, and structured financial news are now available through Polygon’s REST APIs.
This tutorial demonstrates how to detect short-lived statistical anomalies in historical US stock market data by building tools to identify unusual trading patterns and visualize them through a user-friendly web interface.